Learning Center
Writing
Adjust a T-Chart to fit various text structures
October 5, 2018
Graphic organizers can aid readers and writers. However, when students are presented new and different graphic organizers all the time, it’s hard to foster masterful use of any of them.
Don’t introduce a new graphic organizer because the font matches your theme (e.g., Old English font used to track plot details about A Christmas Carol) or the visuals match this week’s topic (e.g., cloud shapes to classify details on the different types of clouds in science). Rather, utilize the same core set of tools that have universal application in different writing genres, text structures, grade levels, and subject areas. This consistent and repeated experience with only a couple of graphic organizers keeps the focus on their intended purpose–to support reader/writer organization.
Such a set of graphic organizers could be limited to three:
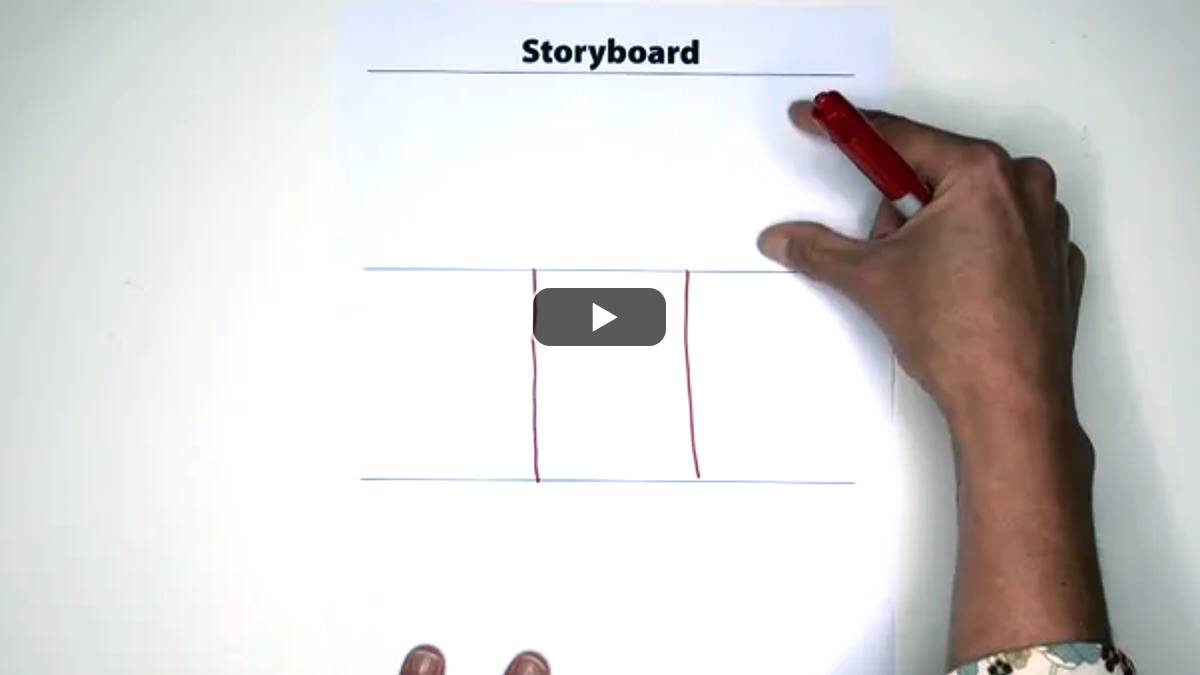
- For information presented in sequence and chronological order use the Storyboard.
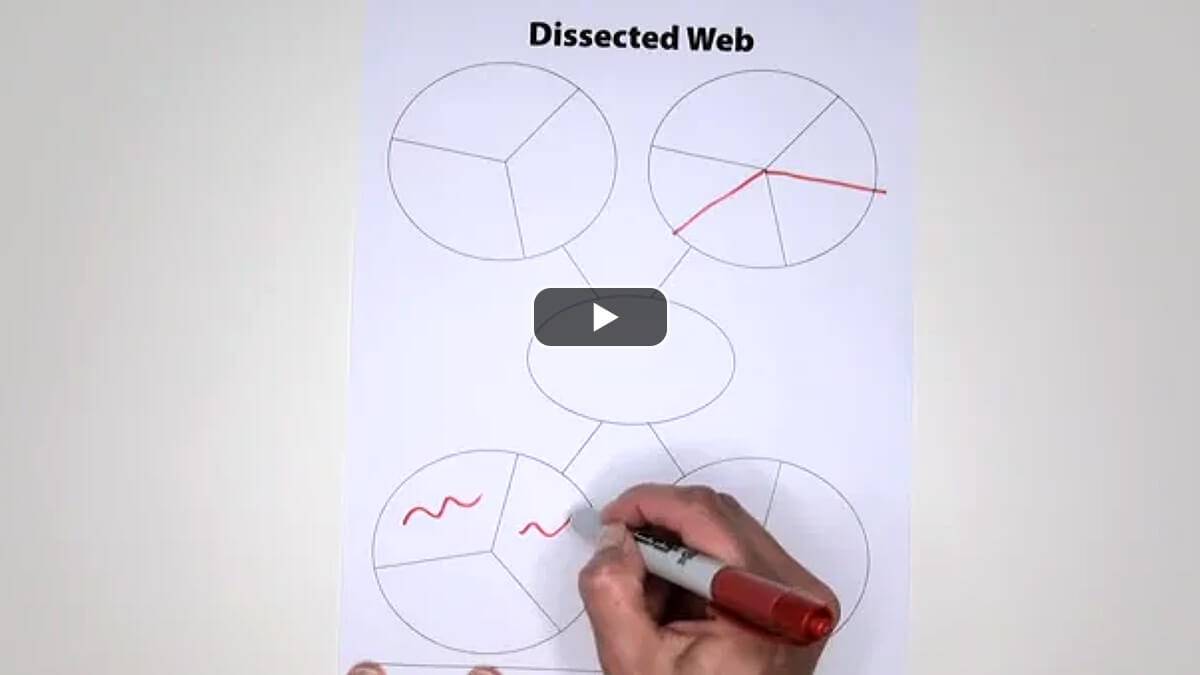
- For information presented in categories (e.g., main idea and supporting details) use the Dissected Web.
- For all other genres and text structures, adapt the T-Chart. (See below.)
By limiting students’ exposure to just three graphic organizers, they can more quickly master them. With repeated experience with the same three tools, students can finally focus their energies on the content they are working with, rather than trying to figure out the organization of yet another set of geometric shapes.
Introduce the 2-column T-Chart
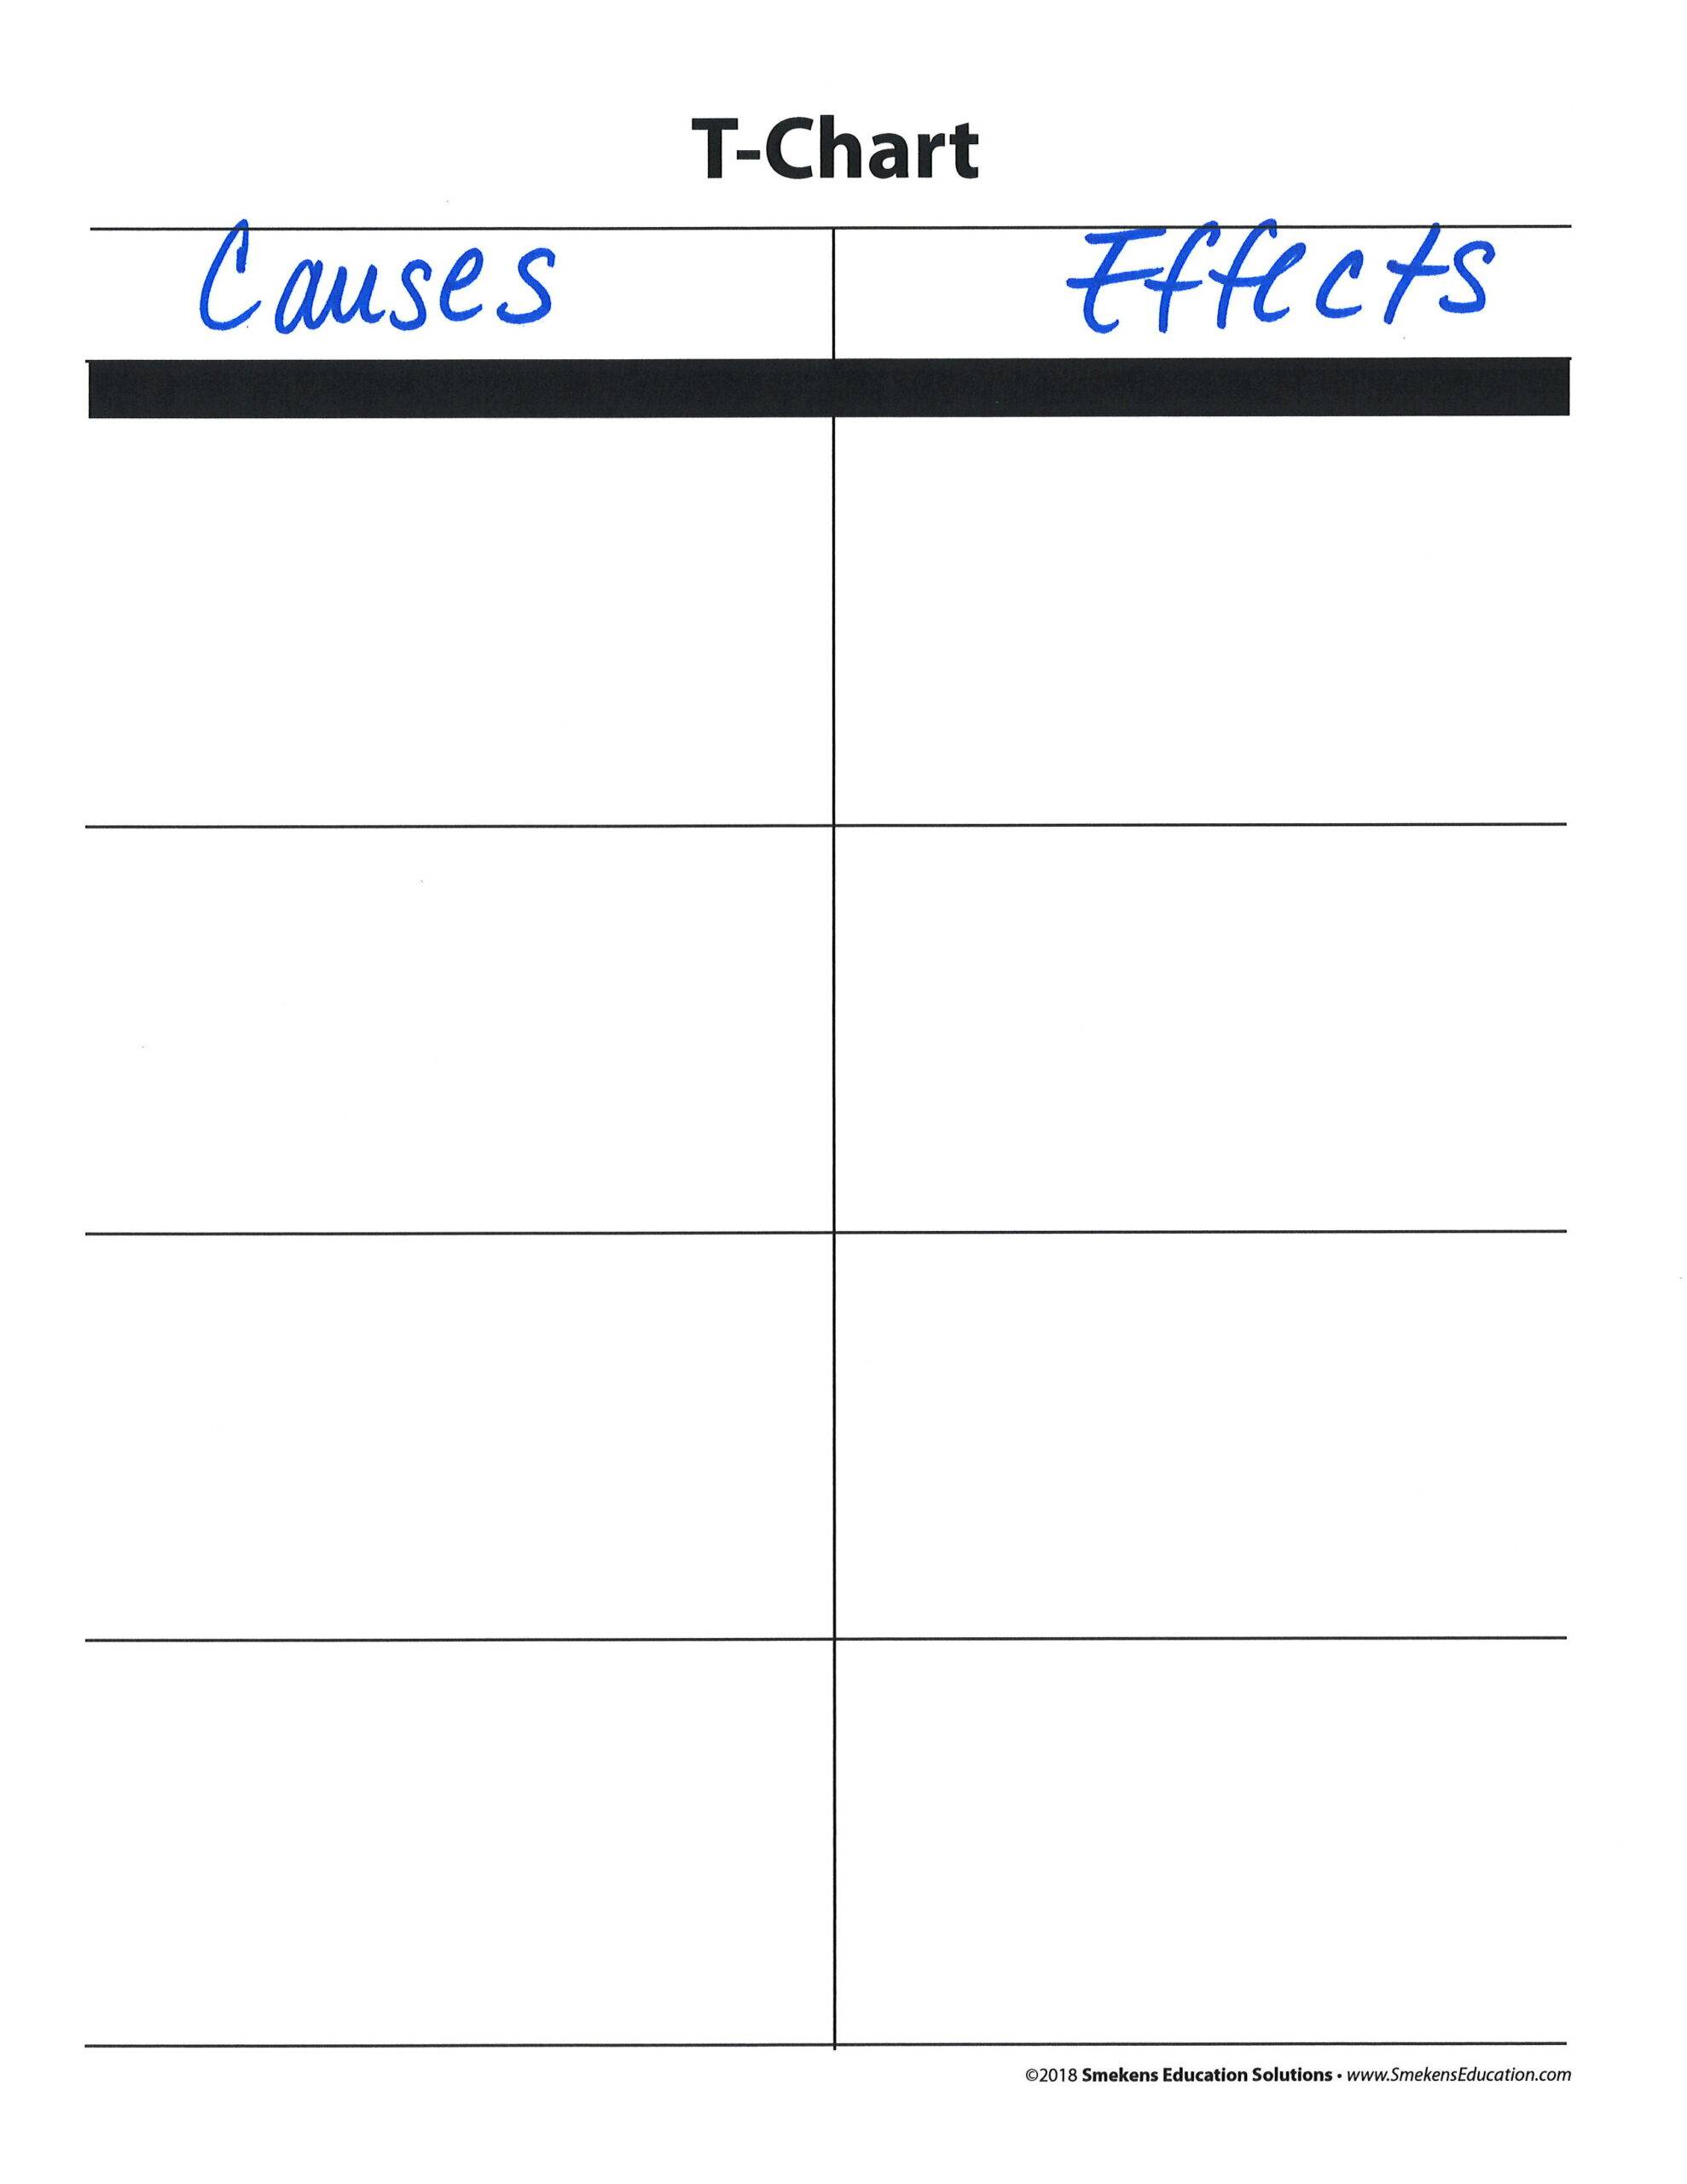
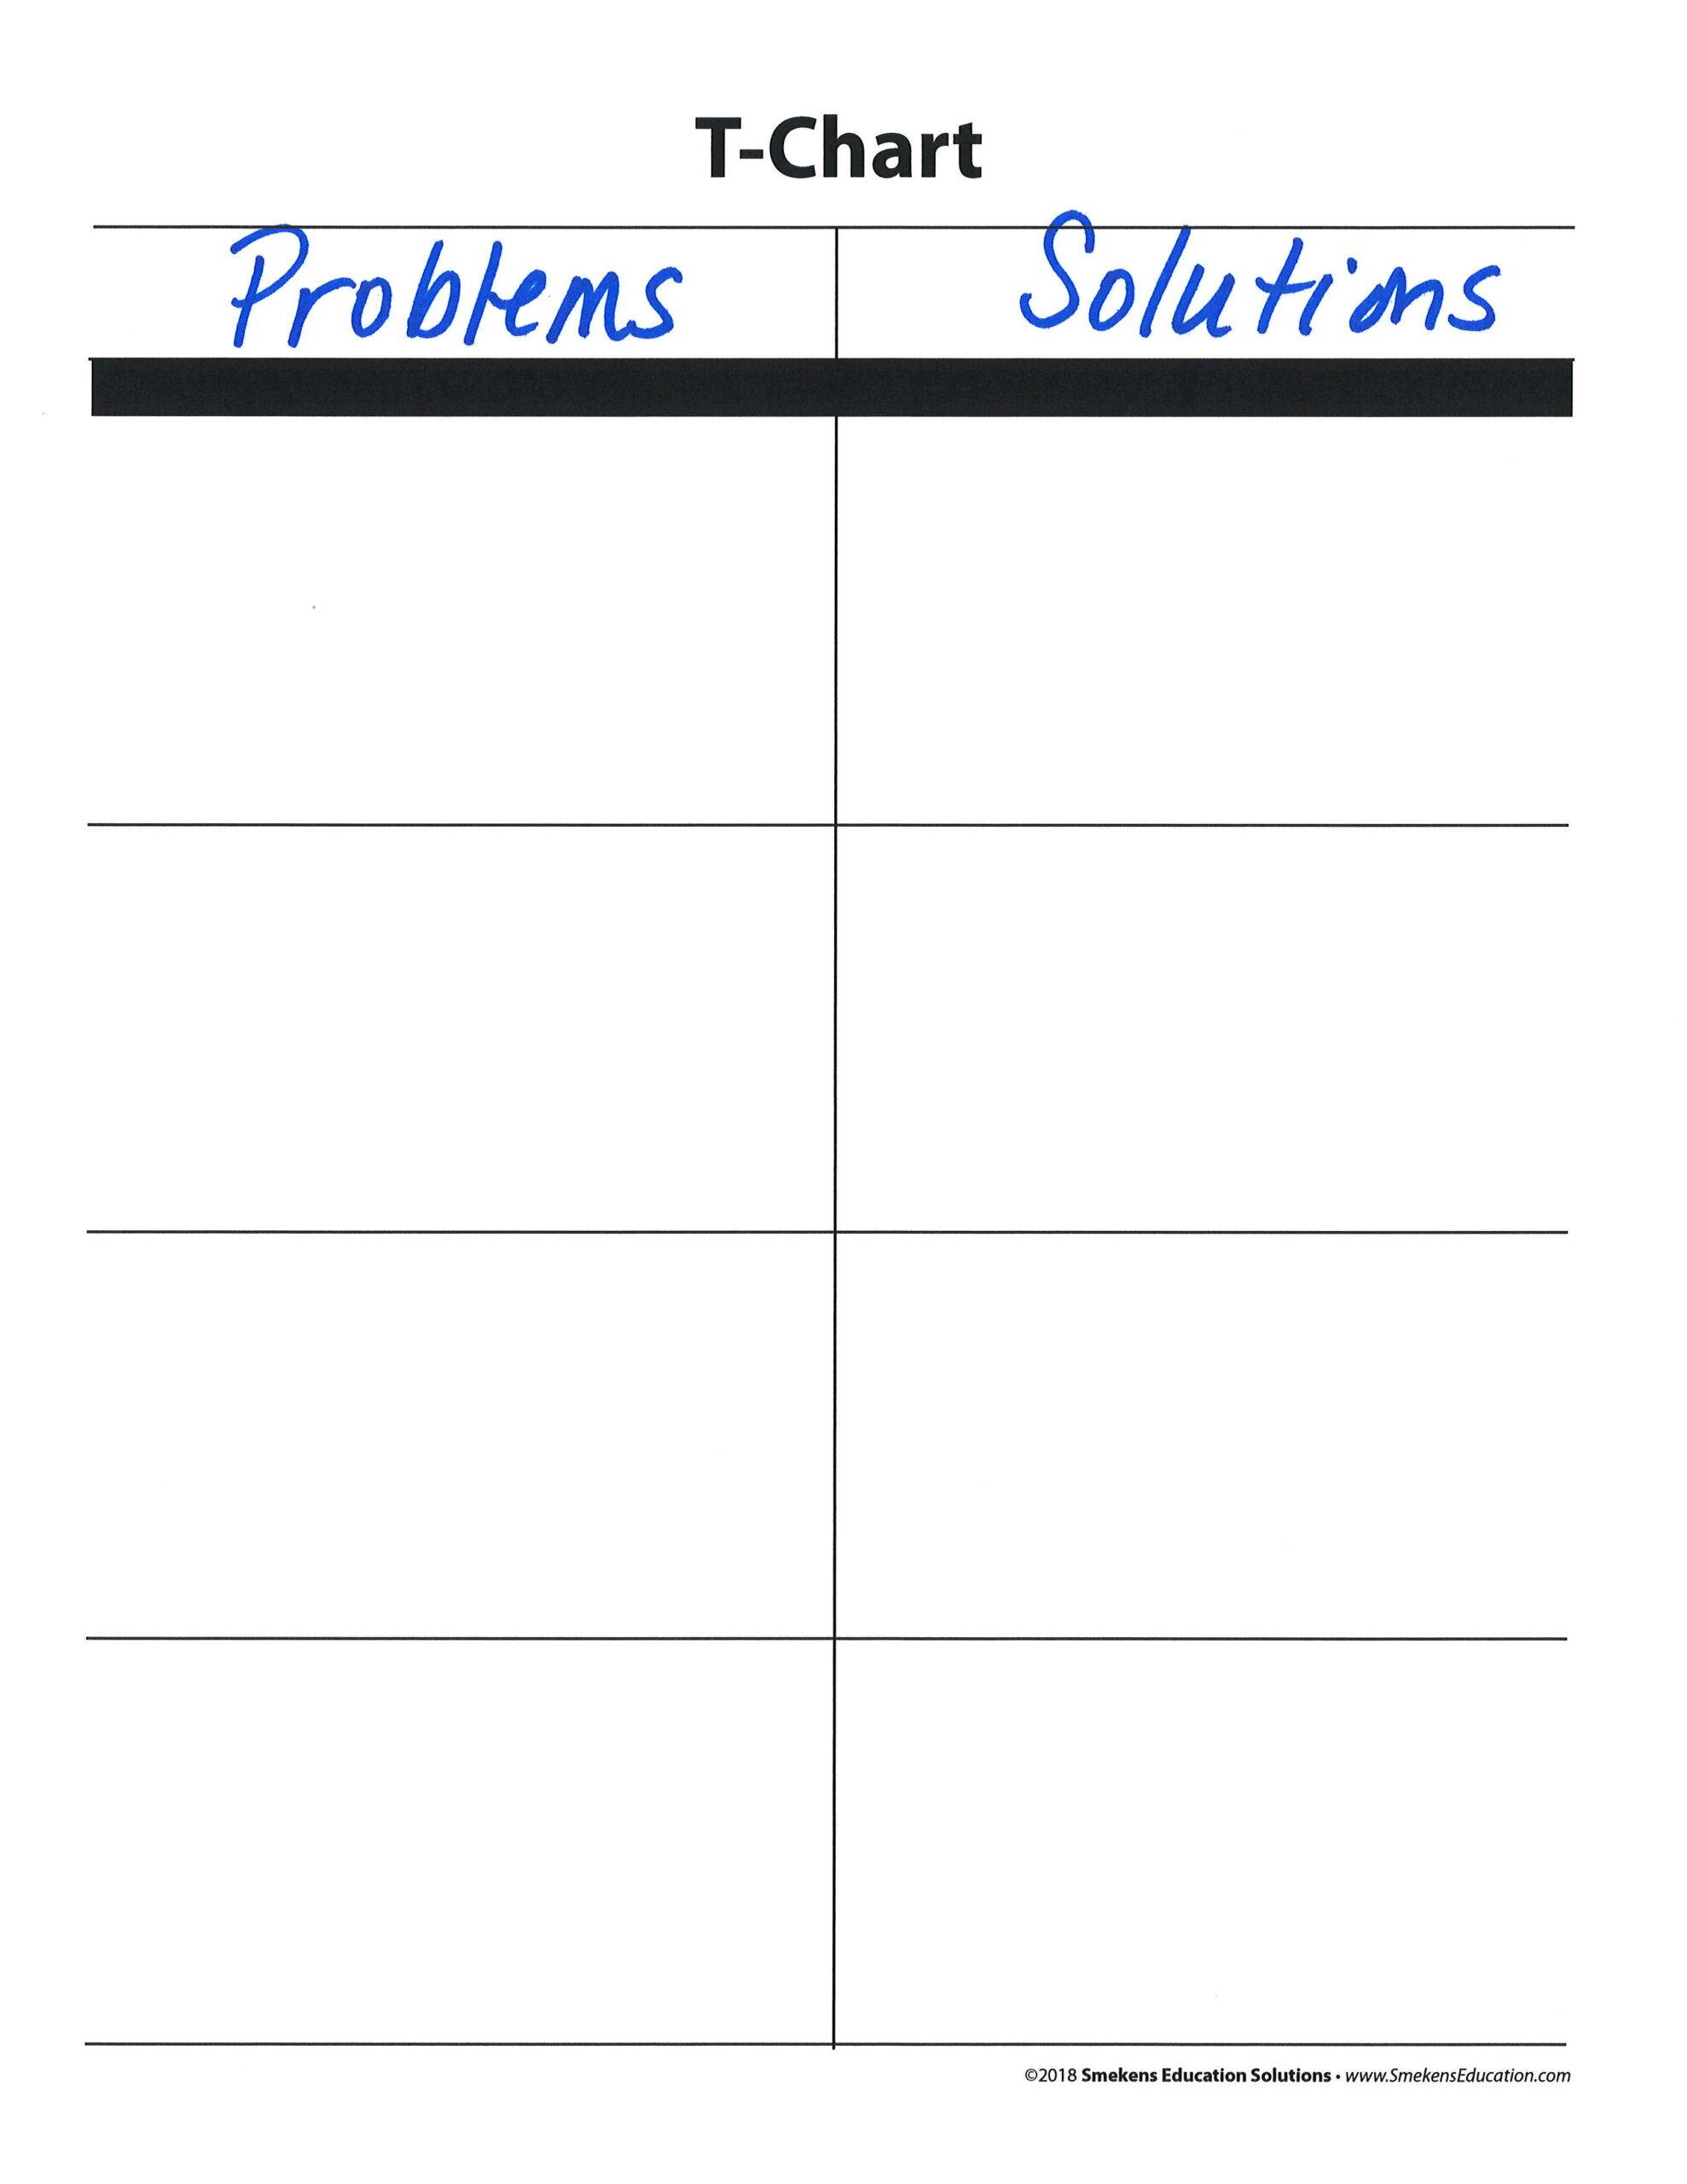
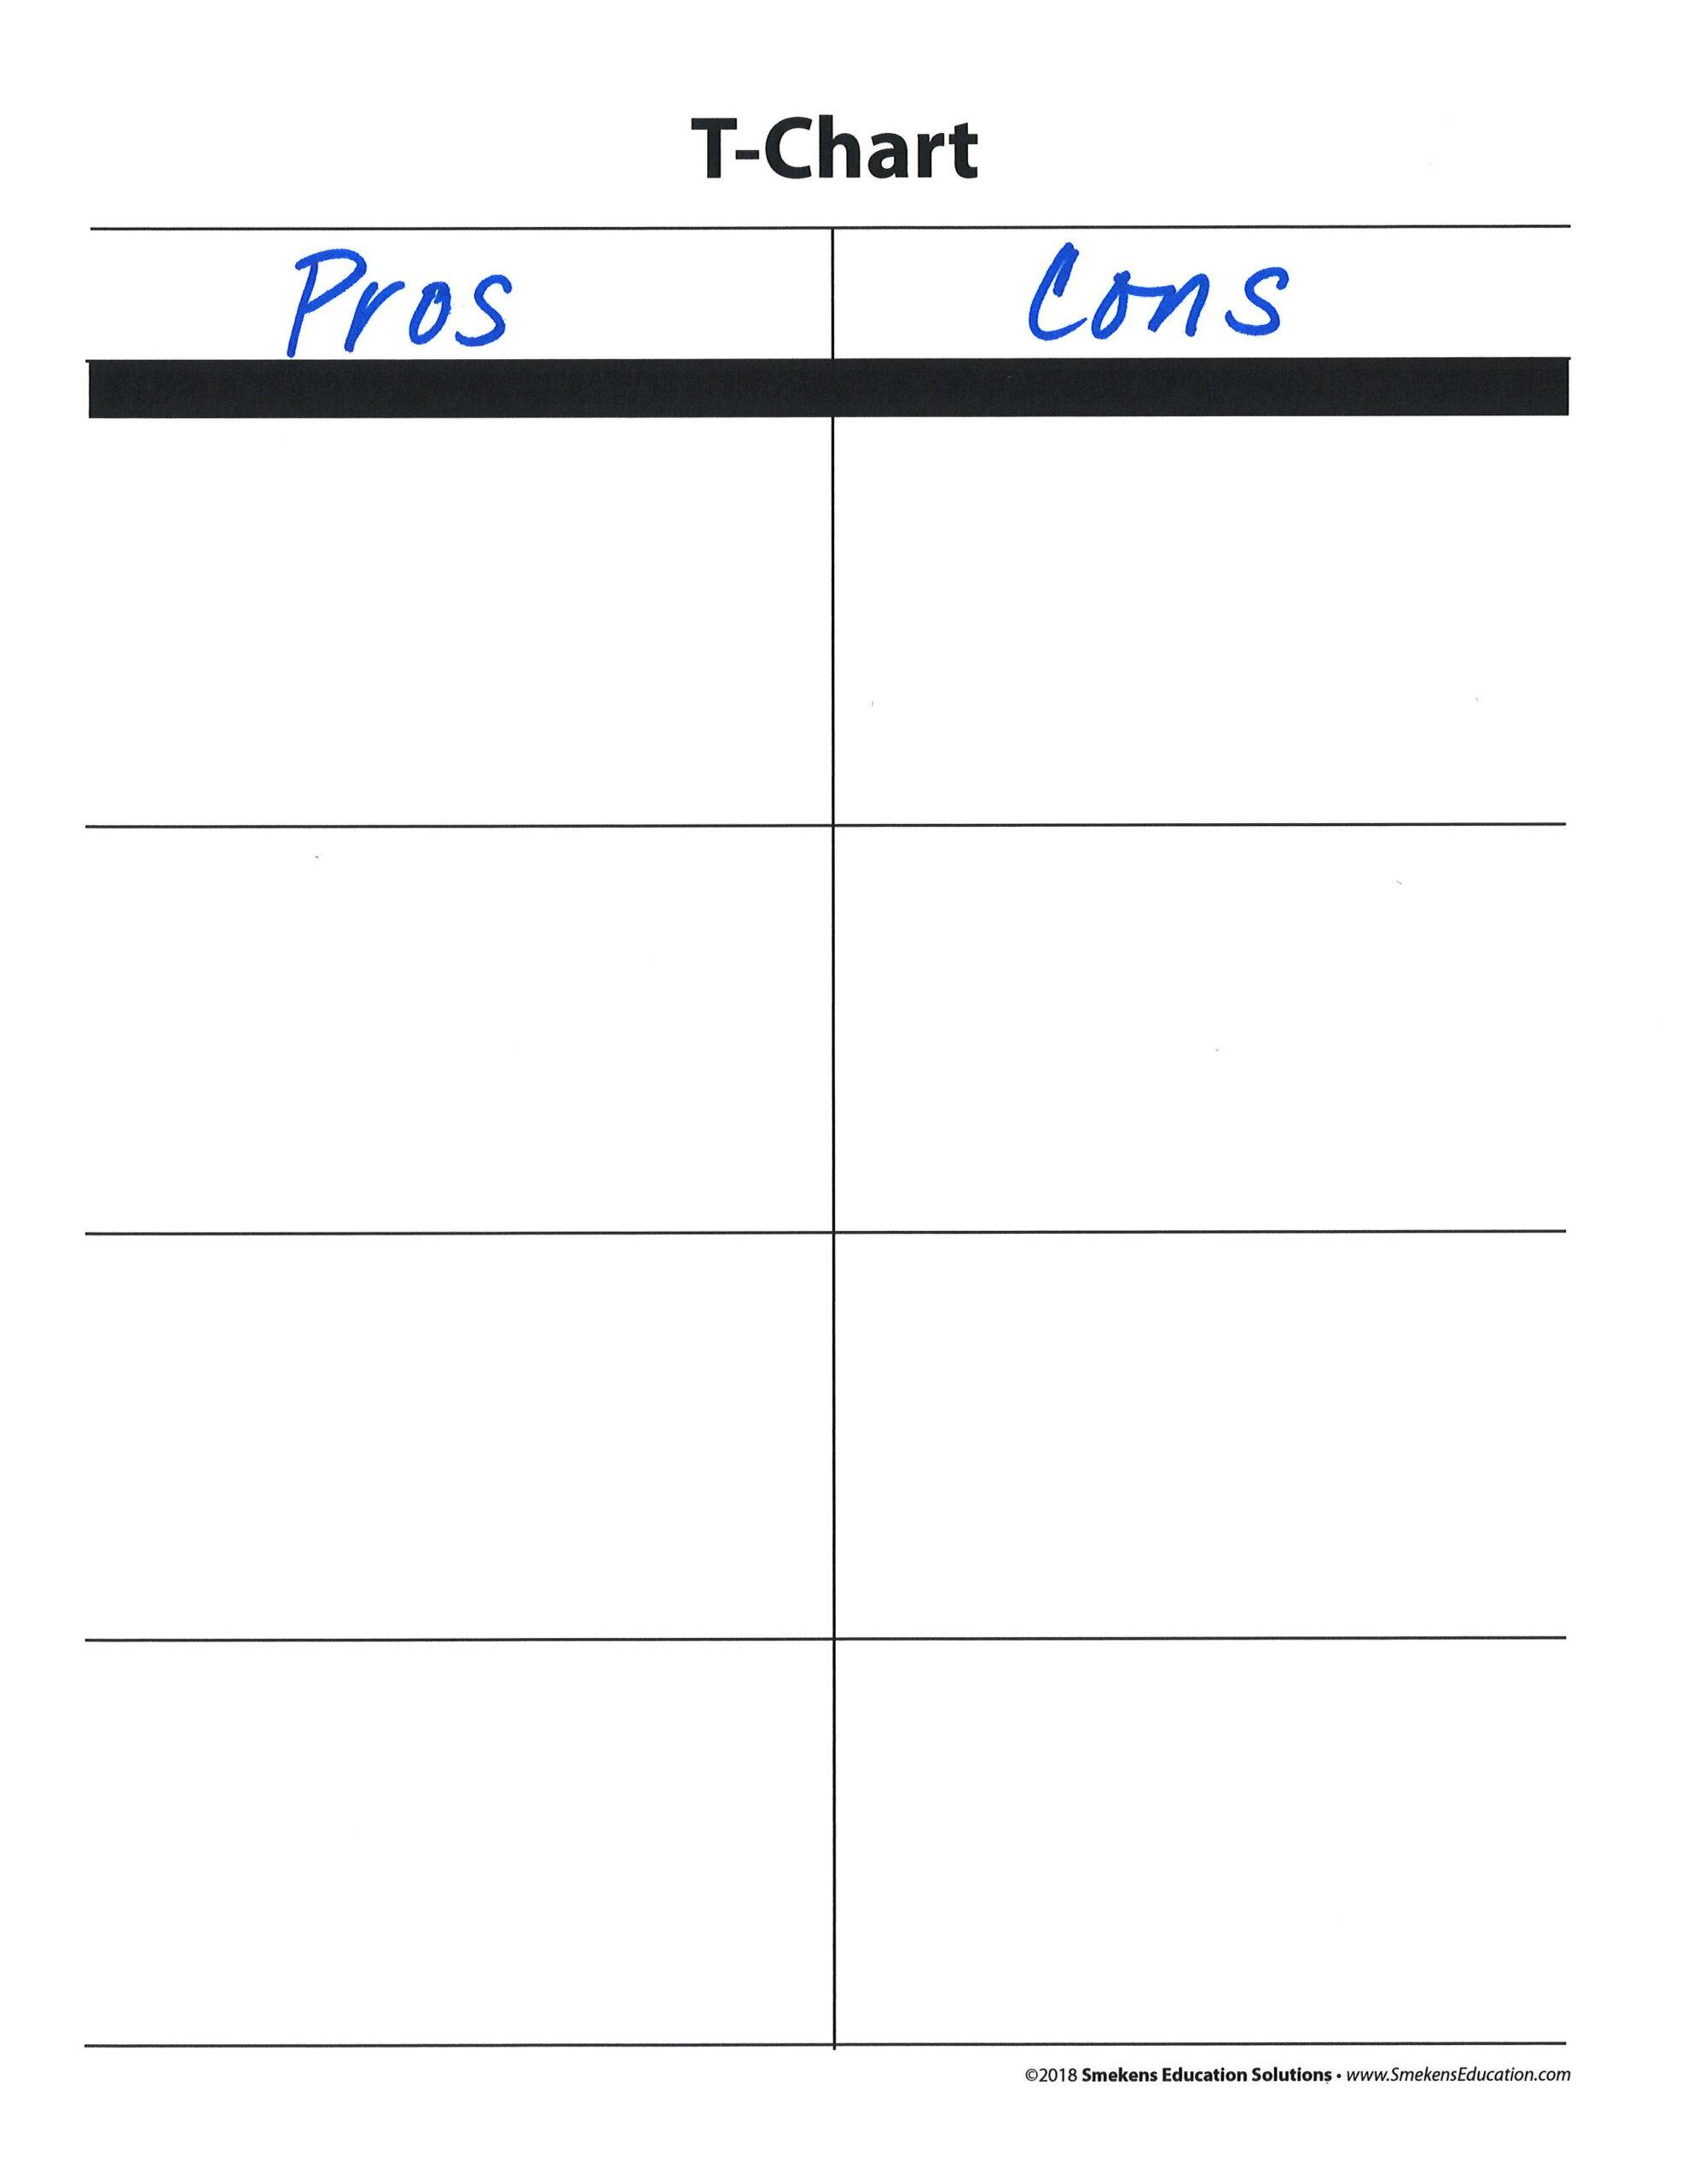
By consistently using a T-Chart, students learn to track information in their reading and plan details for their writing. By simply changing the criteria at the top of the T-Chart, they can organize information into causes and effects, problems and solutions, and pros versus cons.
Adjust the T-Chart to compare and contrast
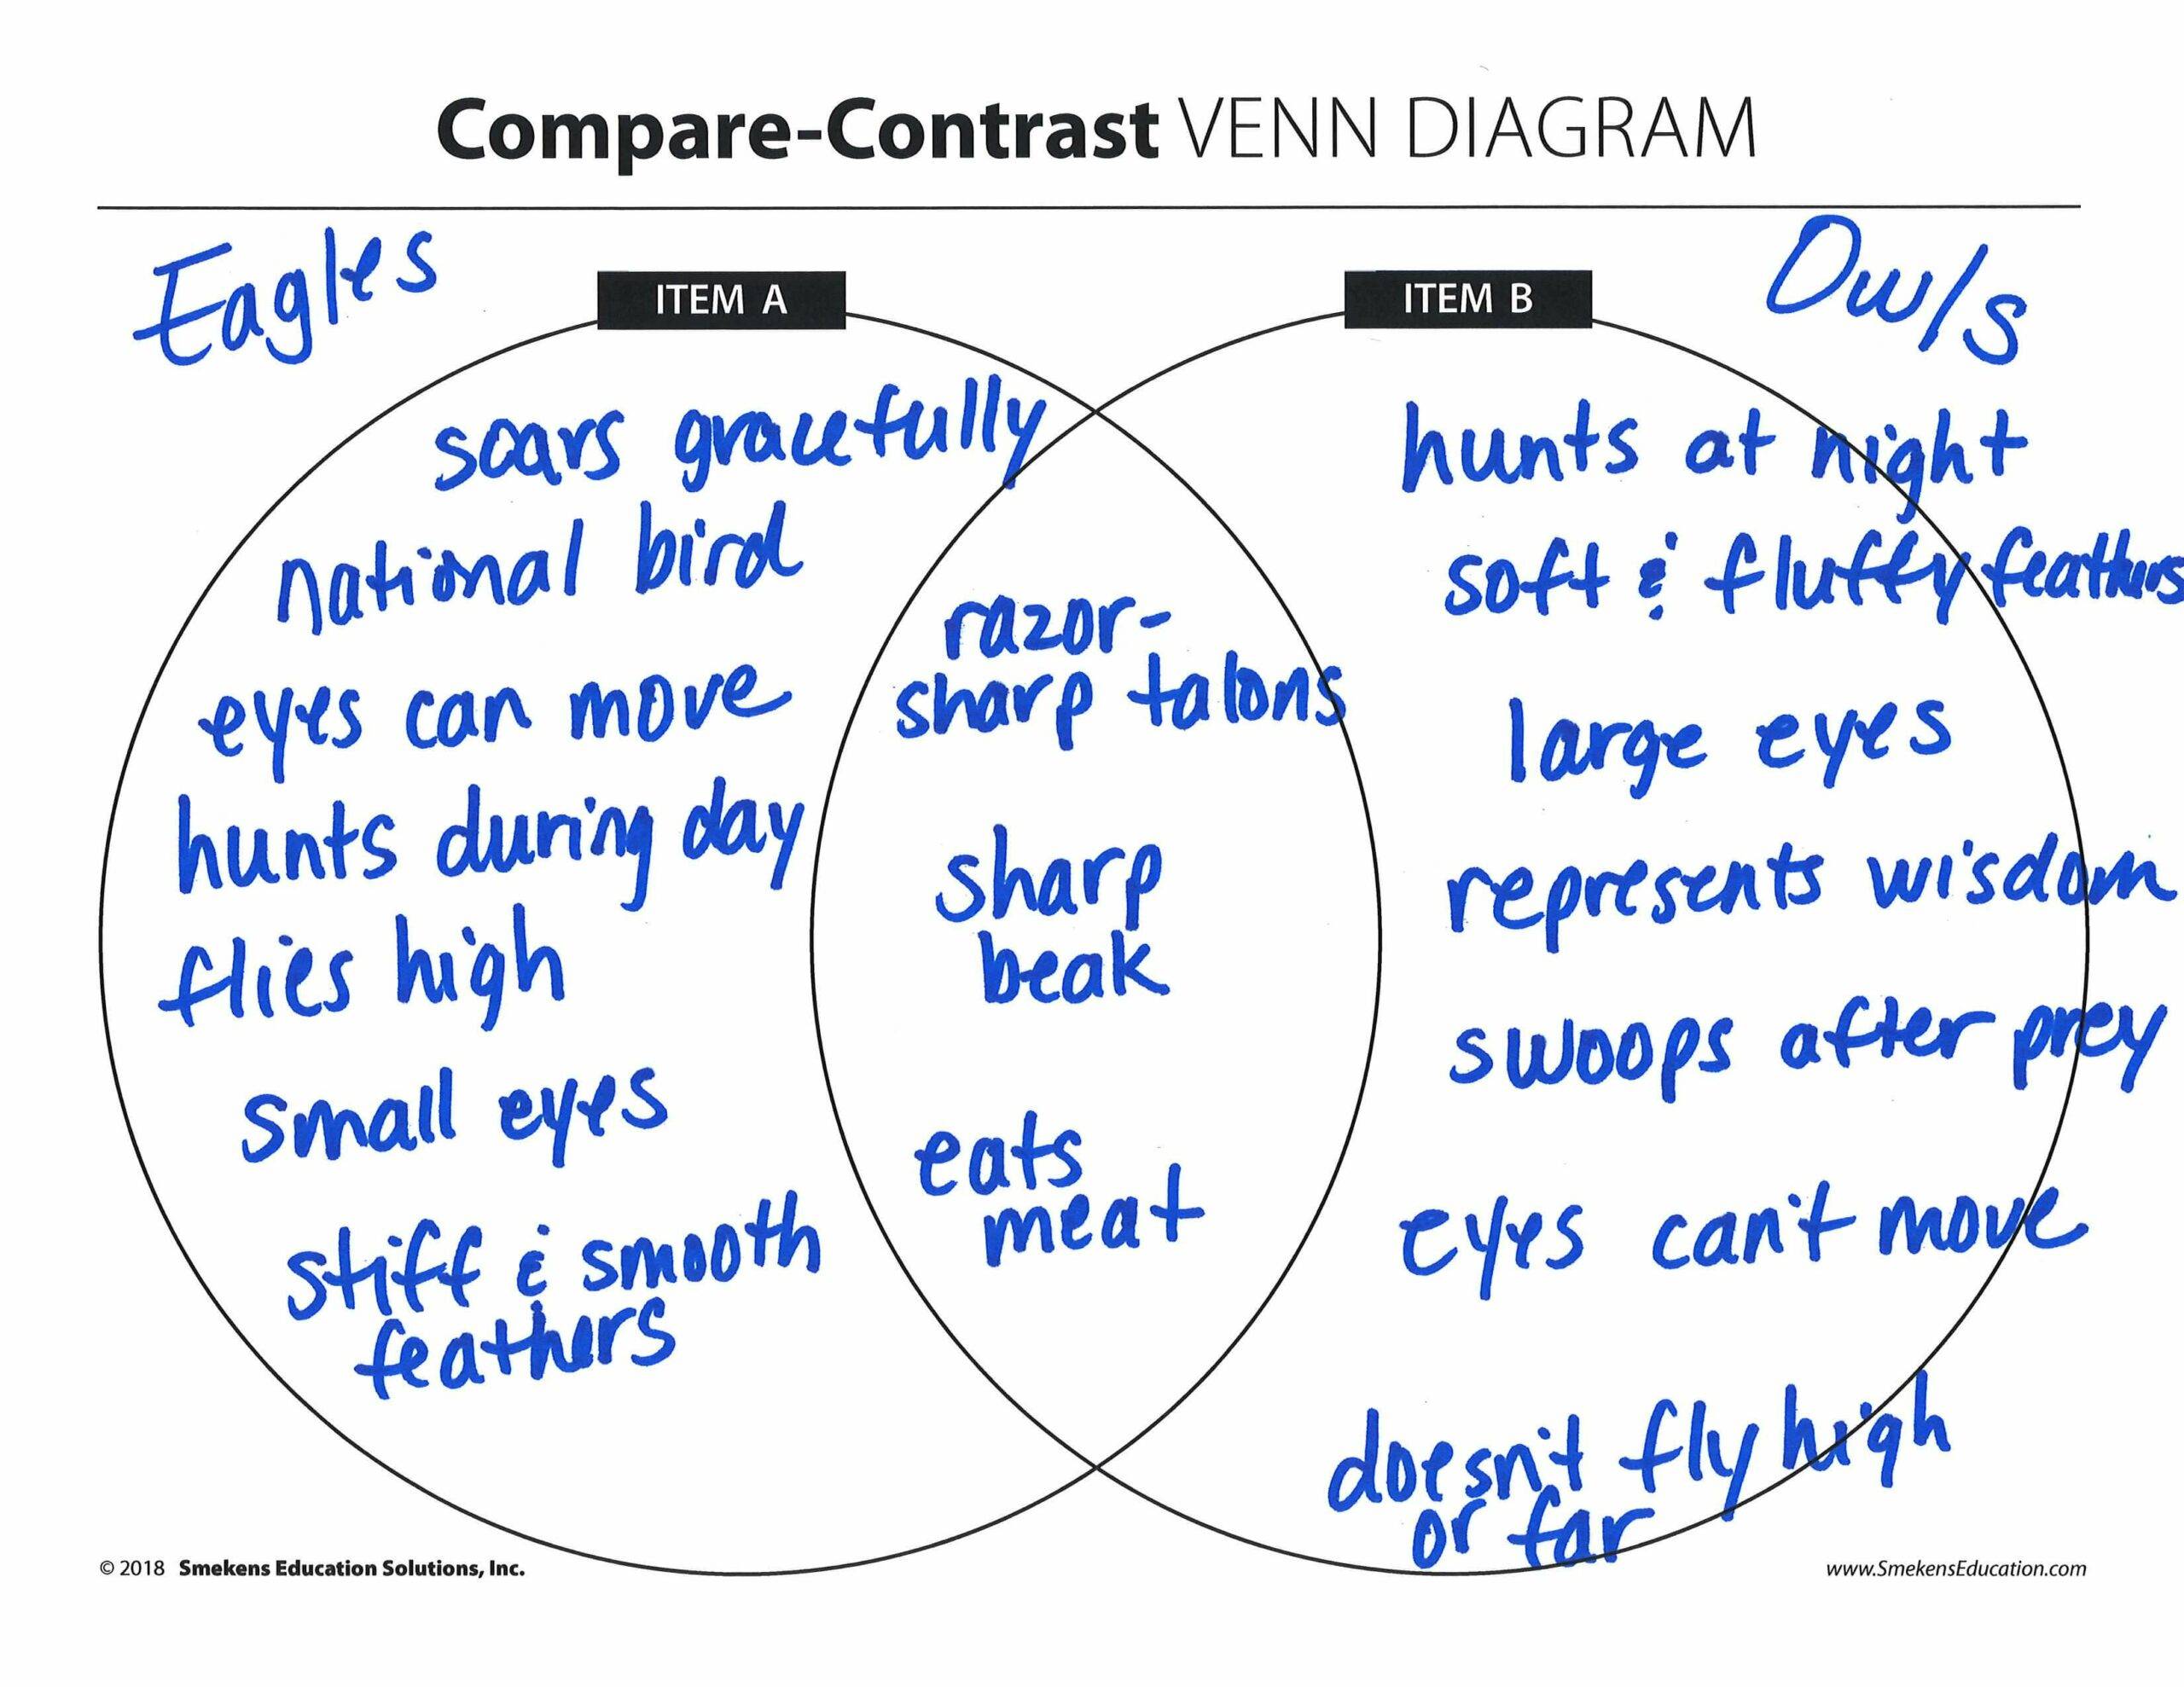
The T-Chart is an excellent tool to collect compare and contrast information, too. In fact, it’s a stronger resource than the traditional Venn Diagram.
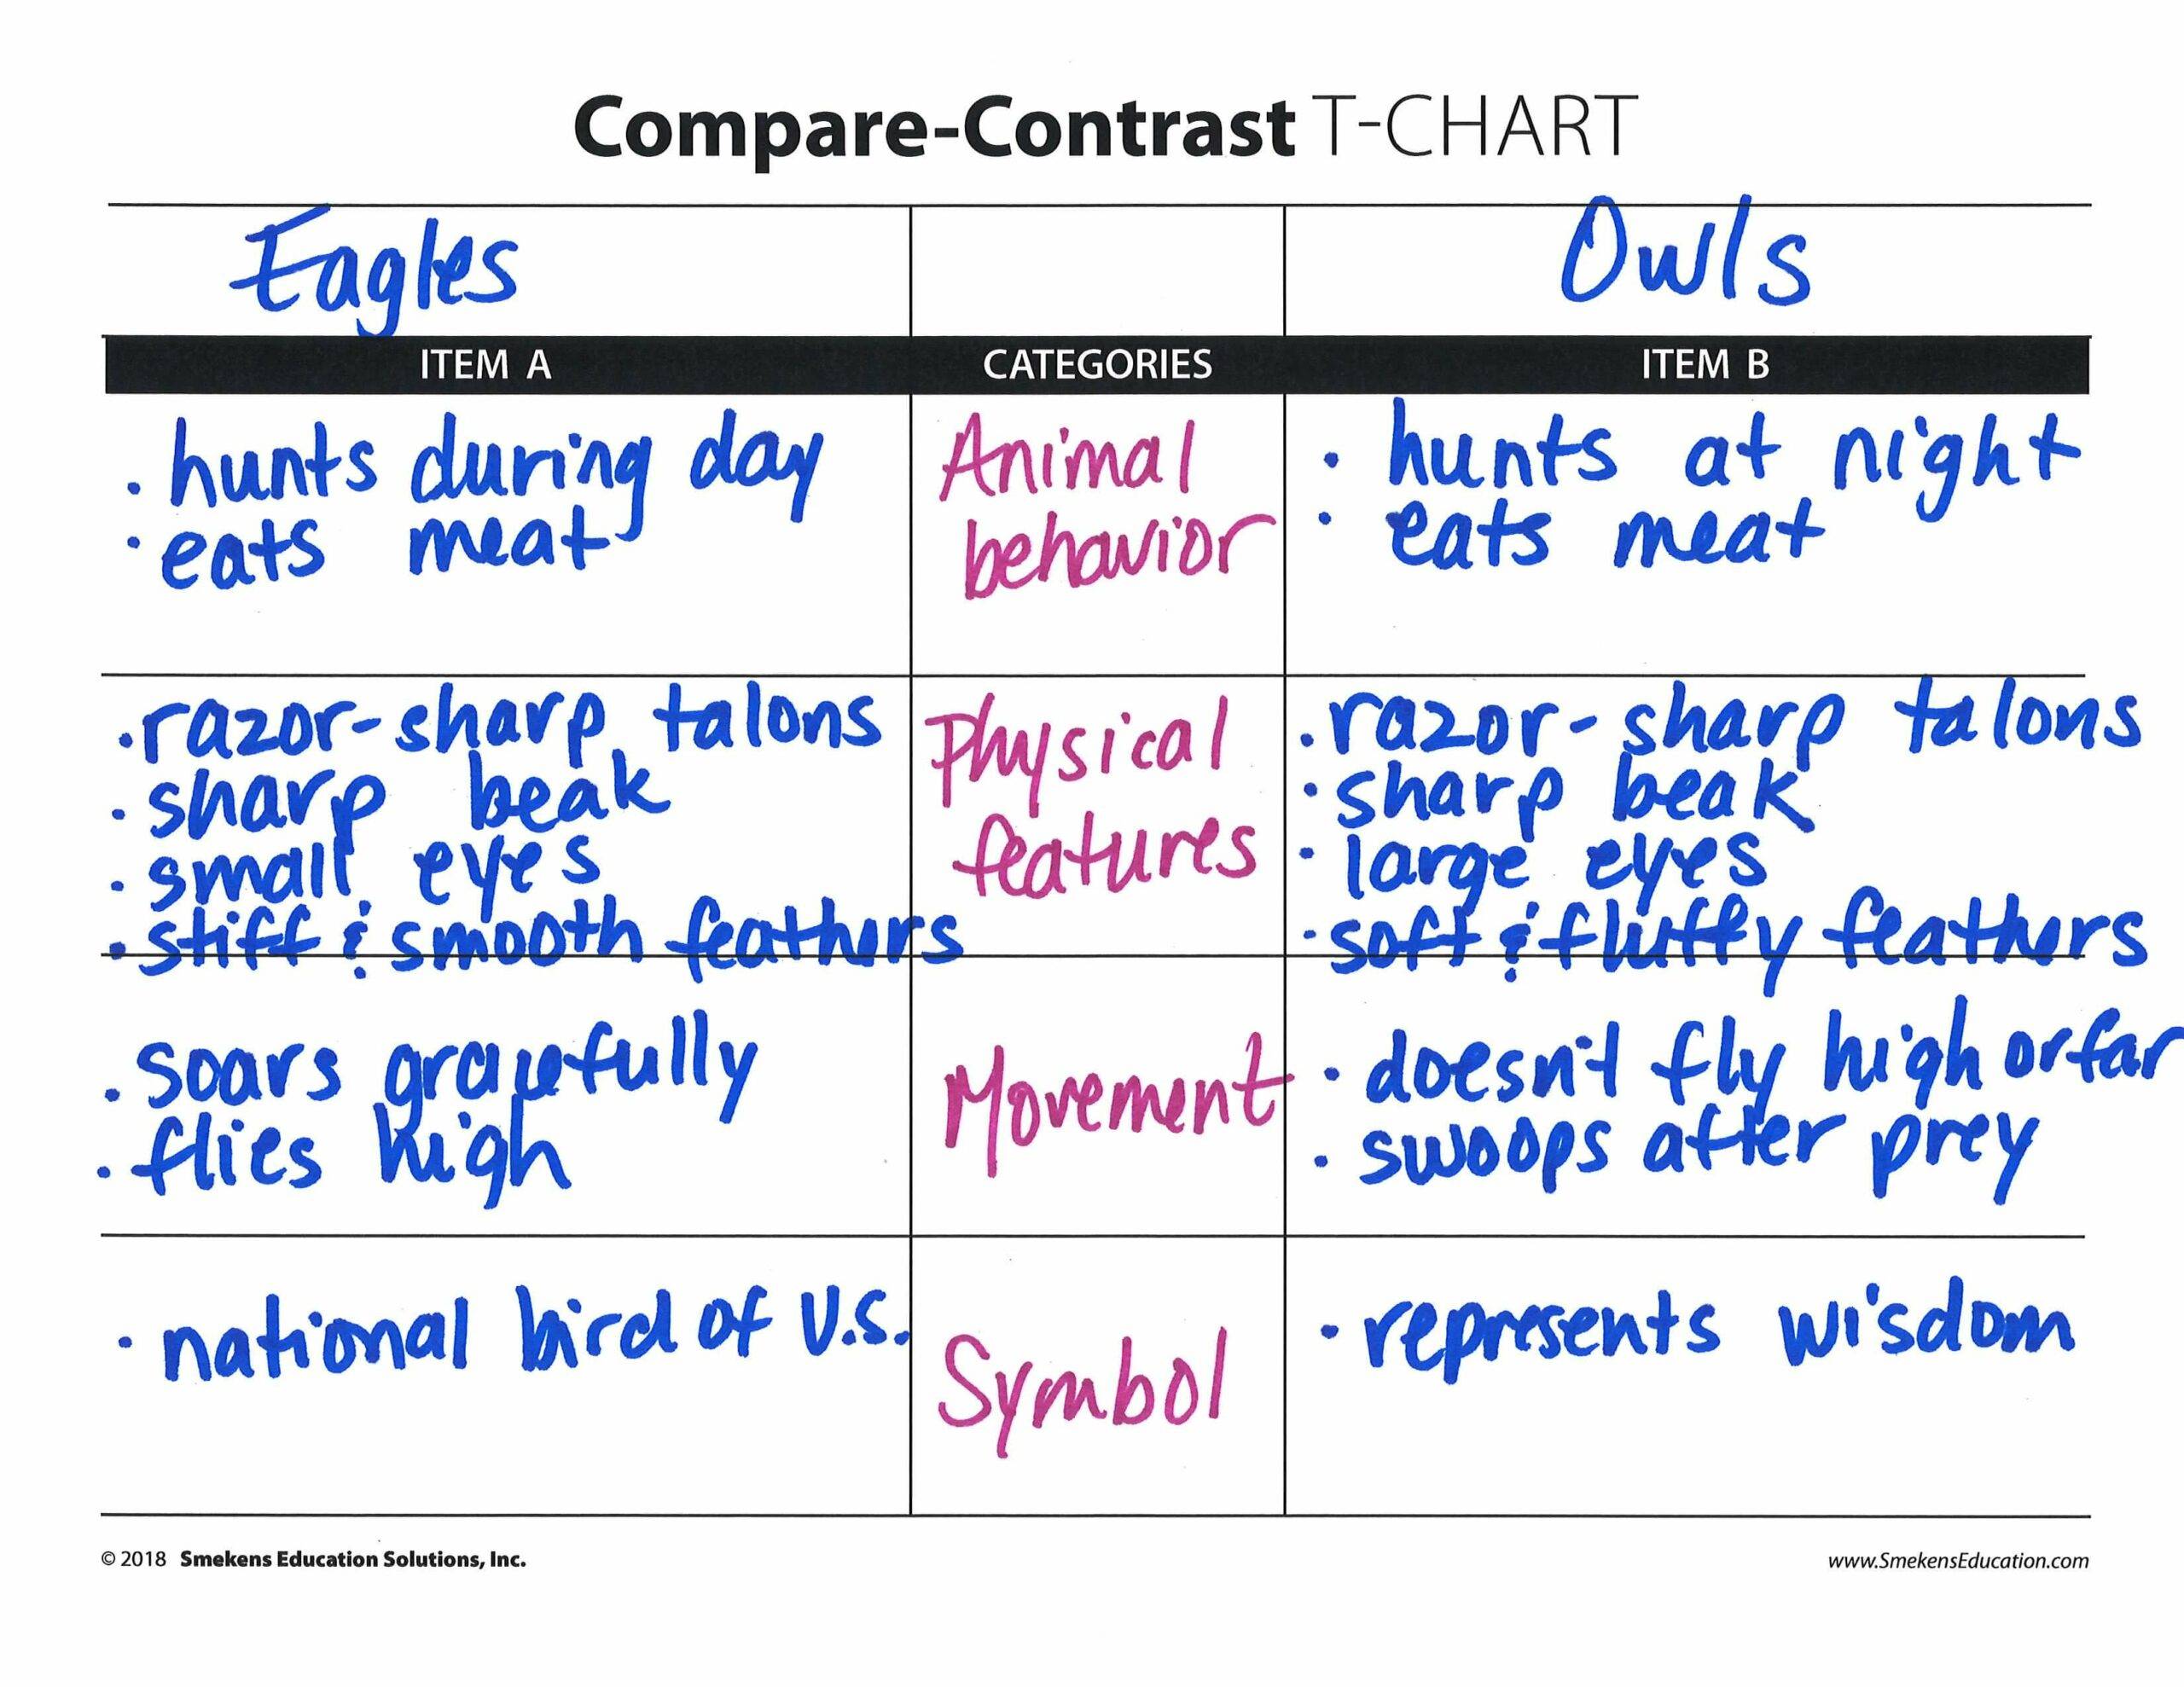
When students are comparing using the Venn Diagram, they separate information about Item A (e.g., eagles) from Item B (e.g., owls), but rarely is that information placed parallel to one another. This is one of the biggest advantages to the T-Chart—it offers organization.
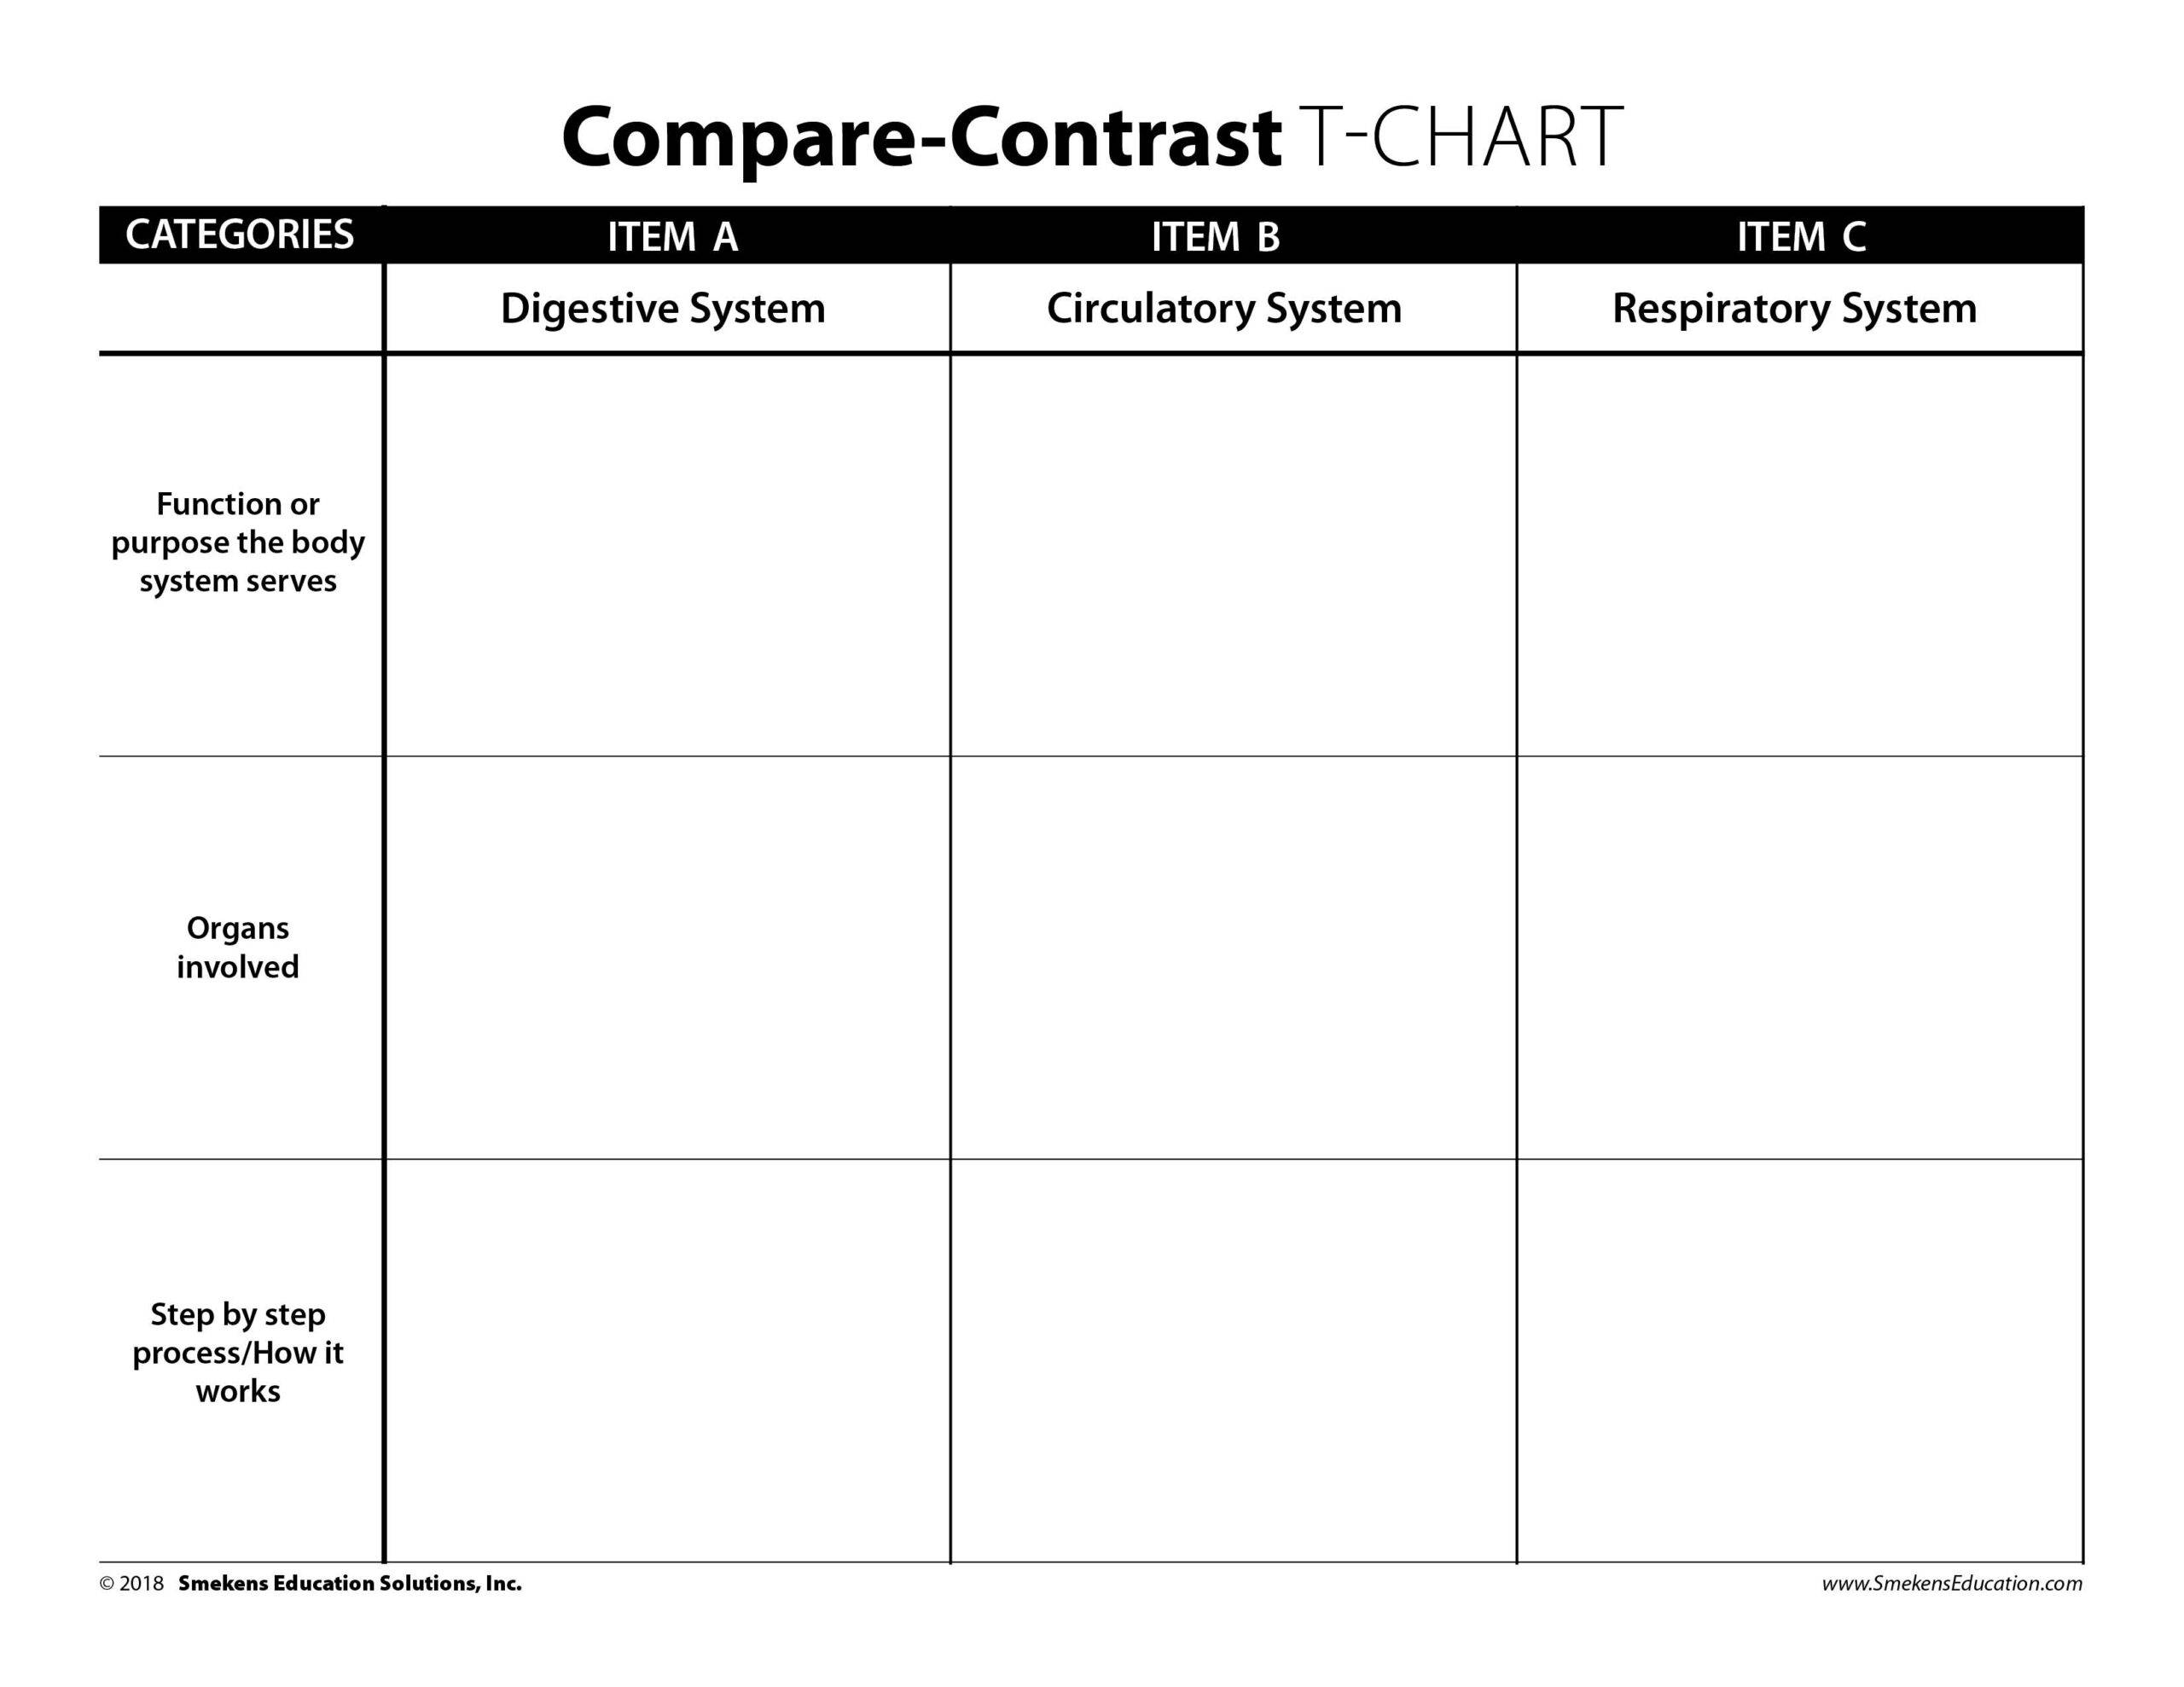
Notice how the T-Chart puts comparative information across from one another.
Expand the T-Chart to improve reader/writer organization
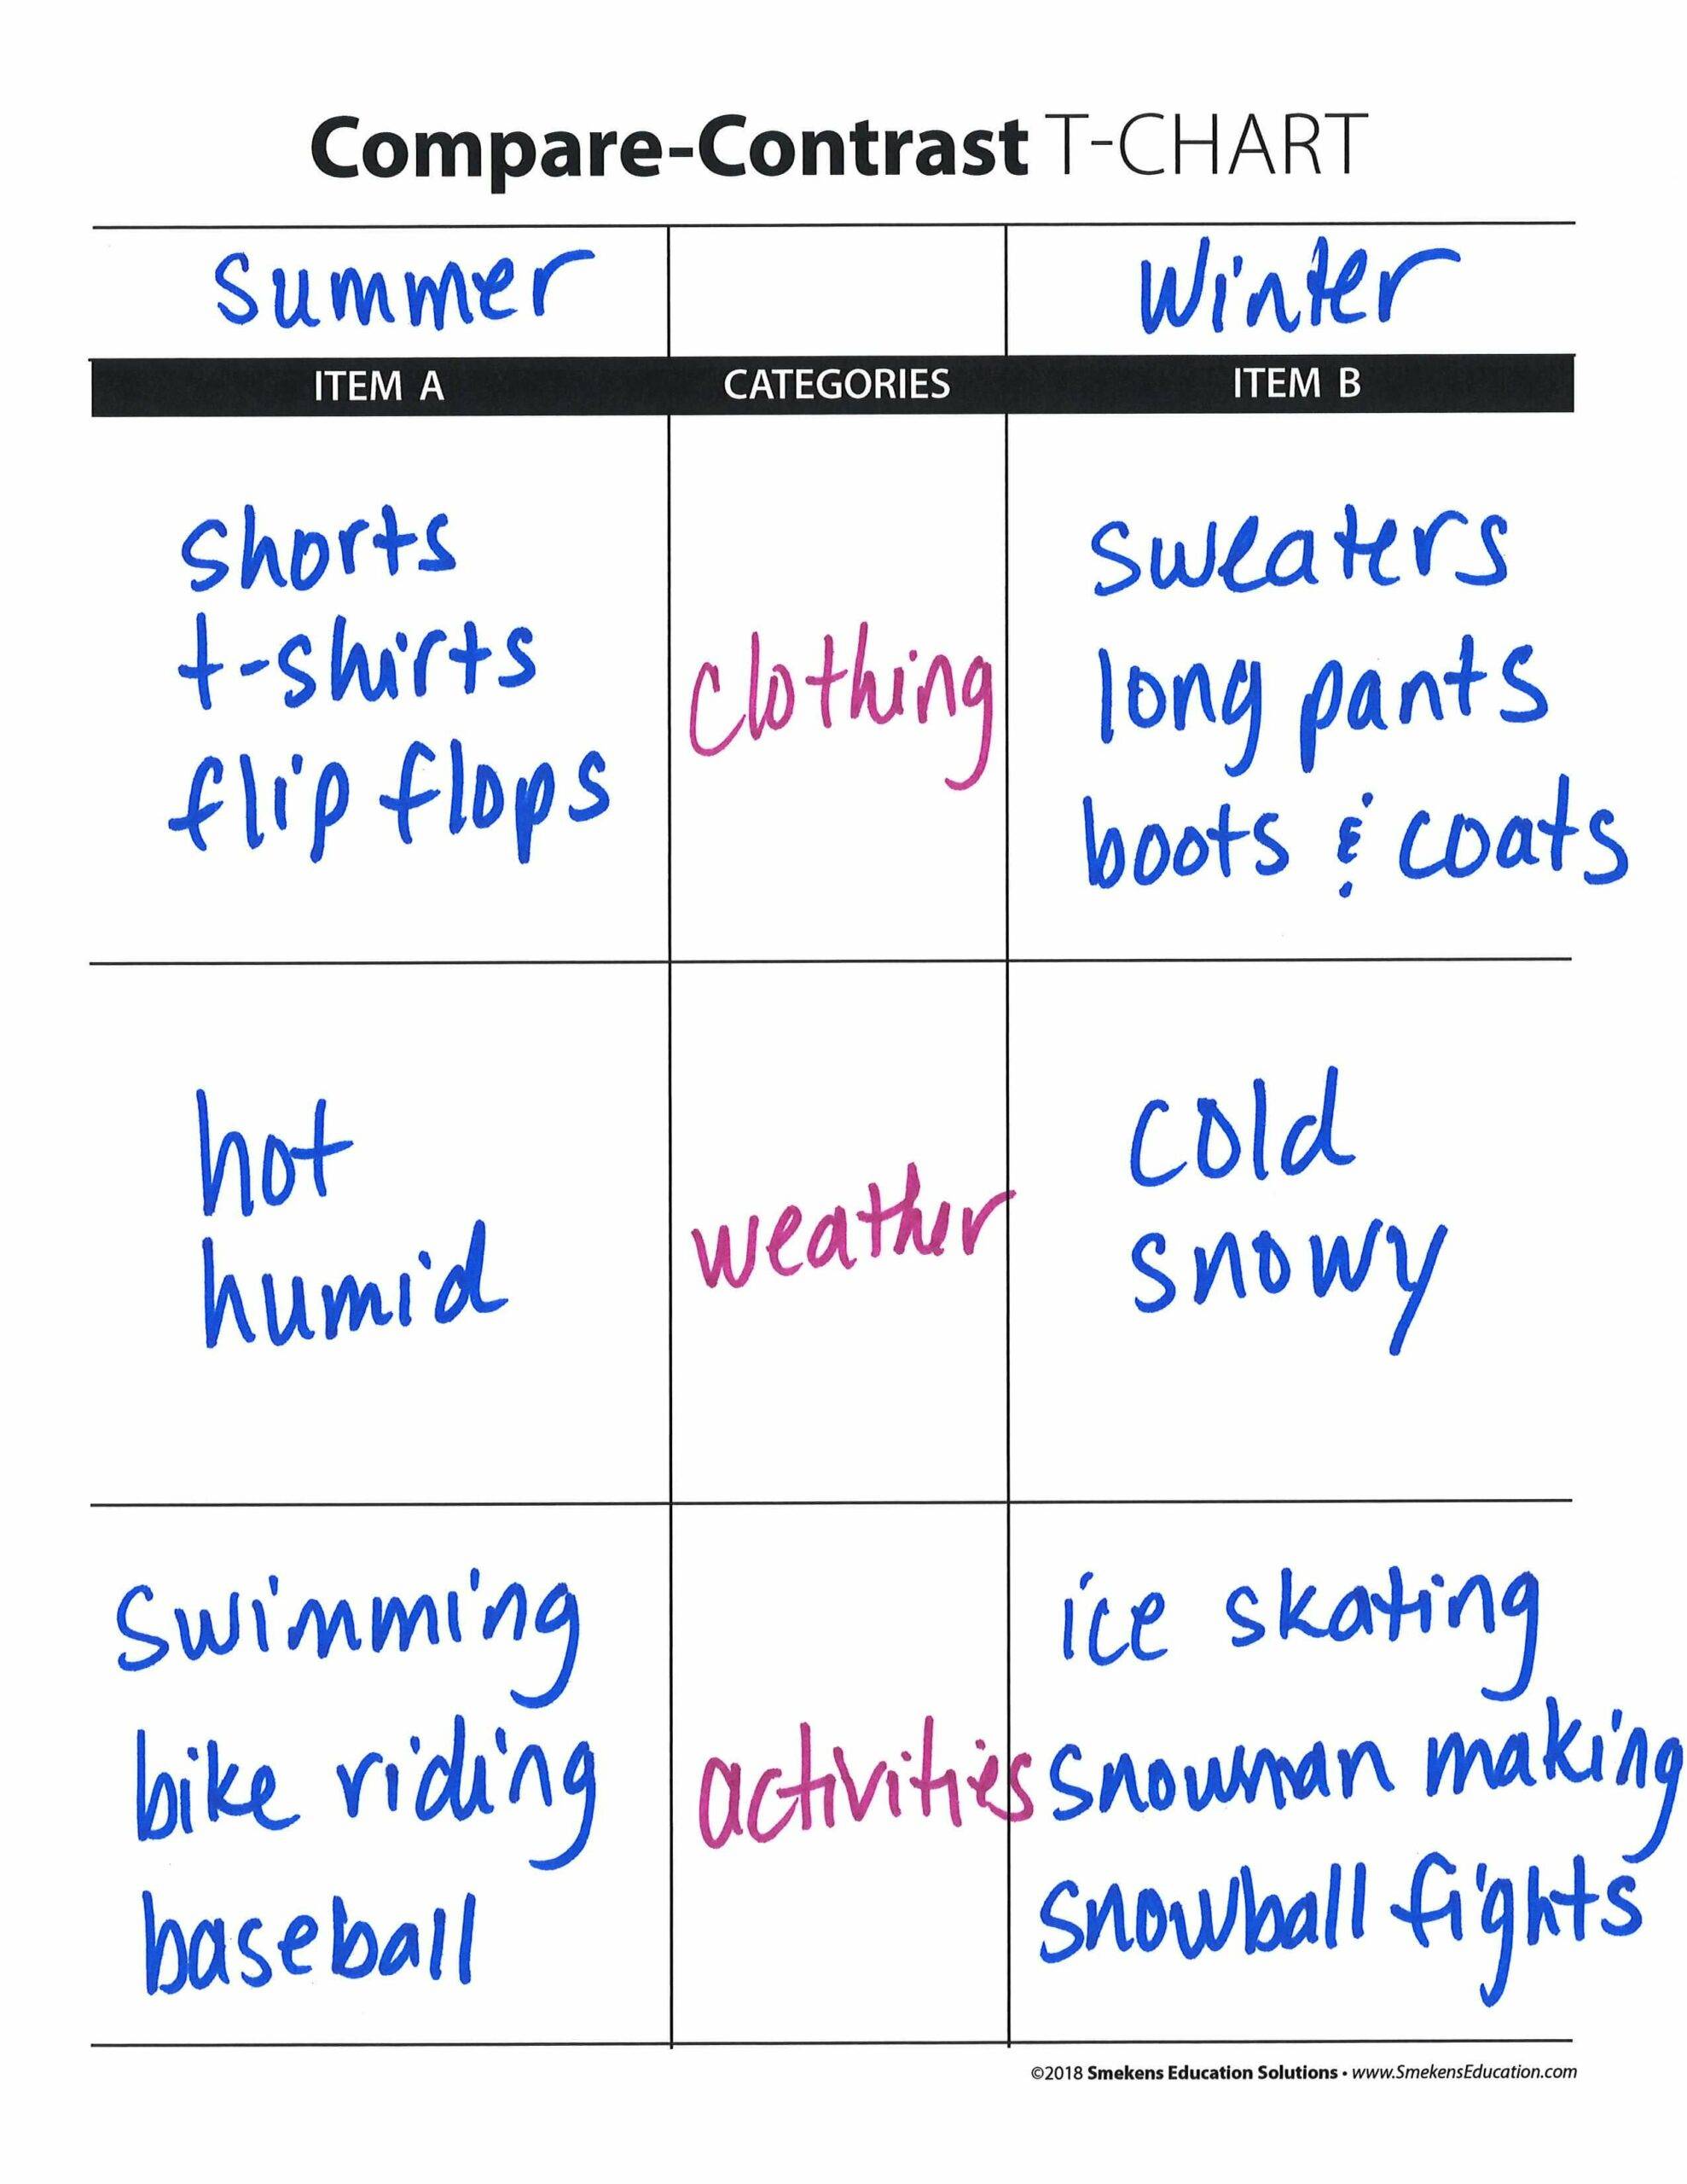
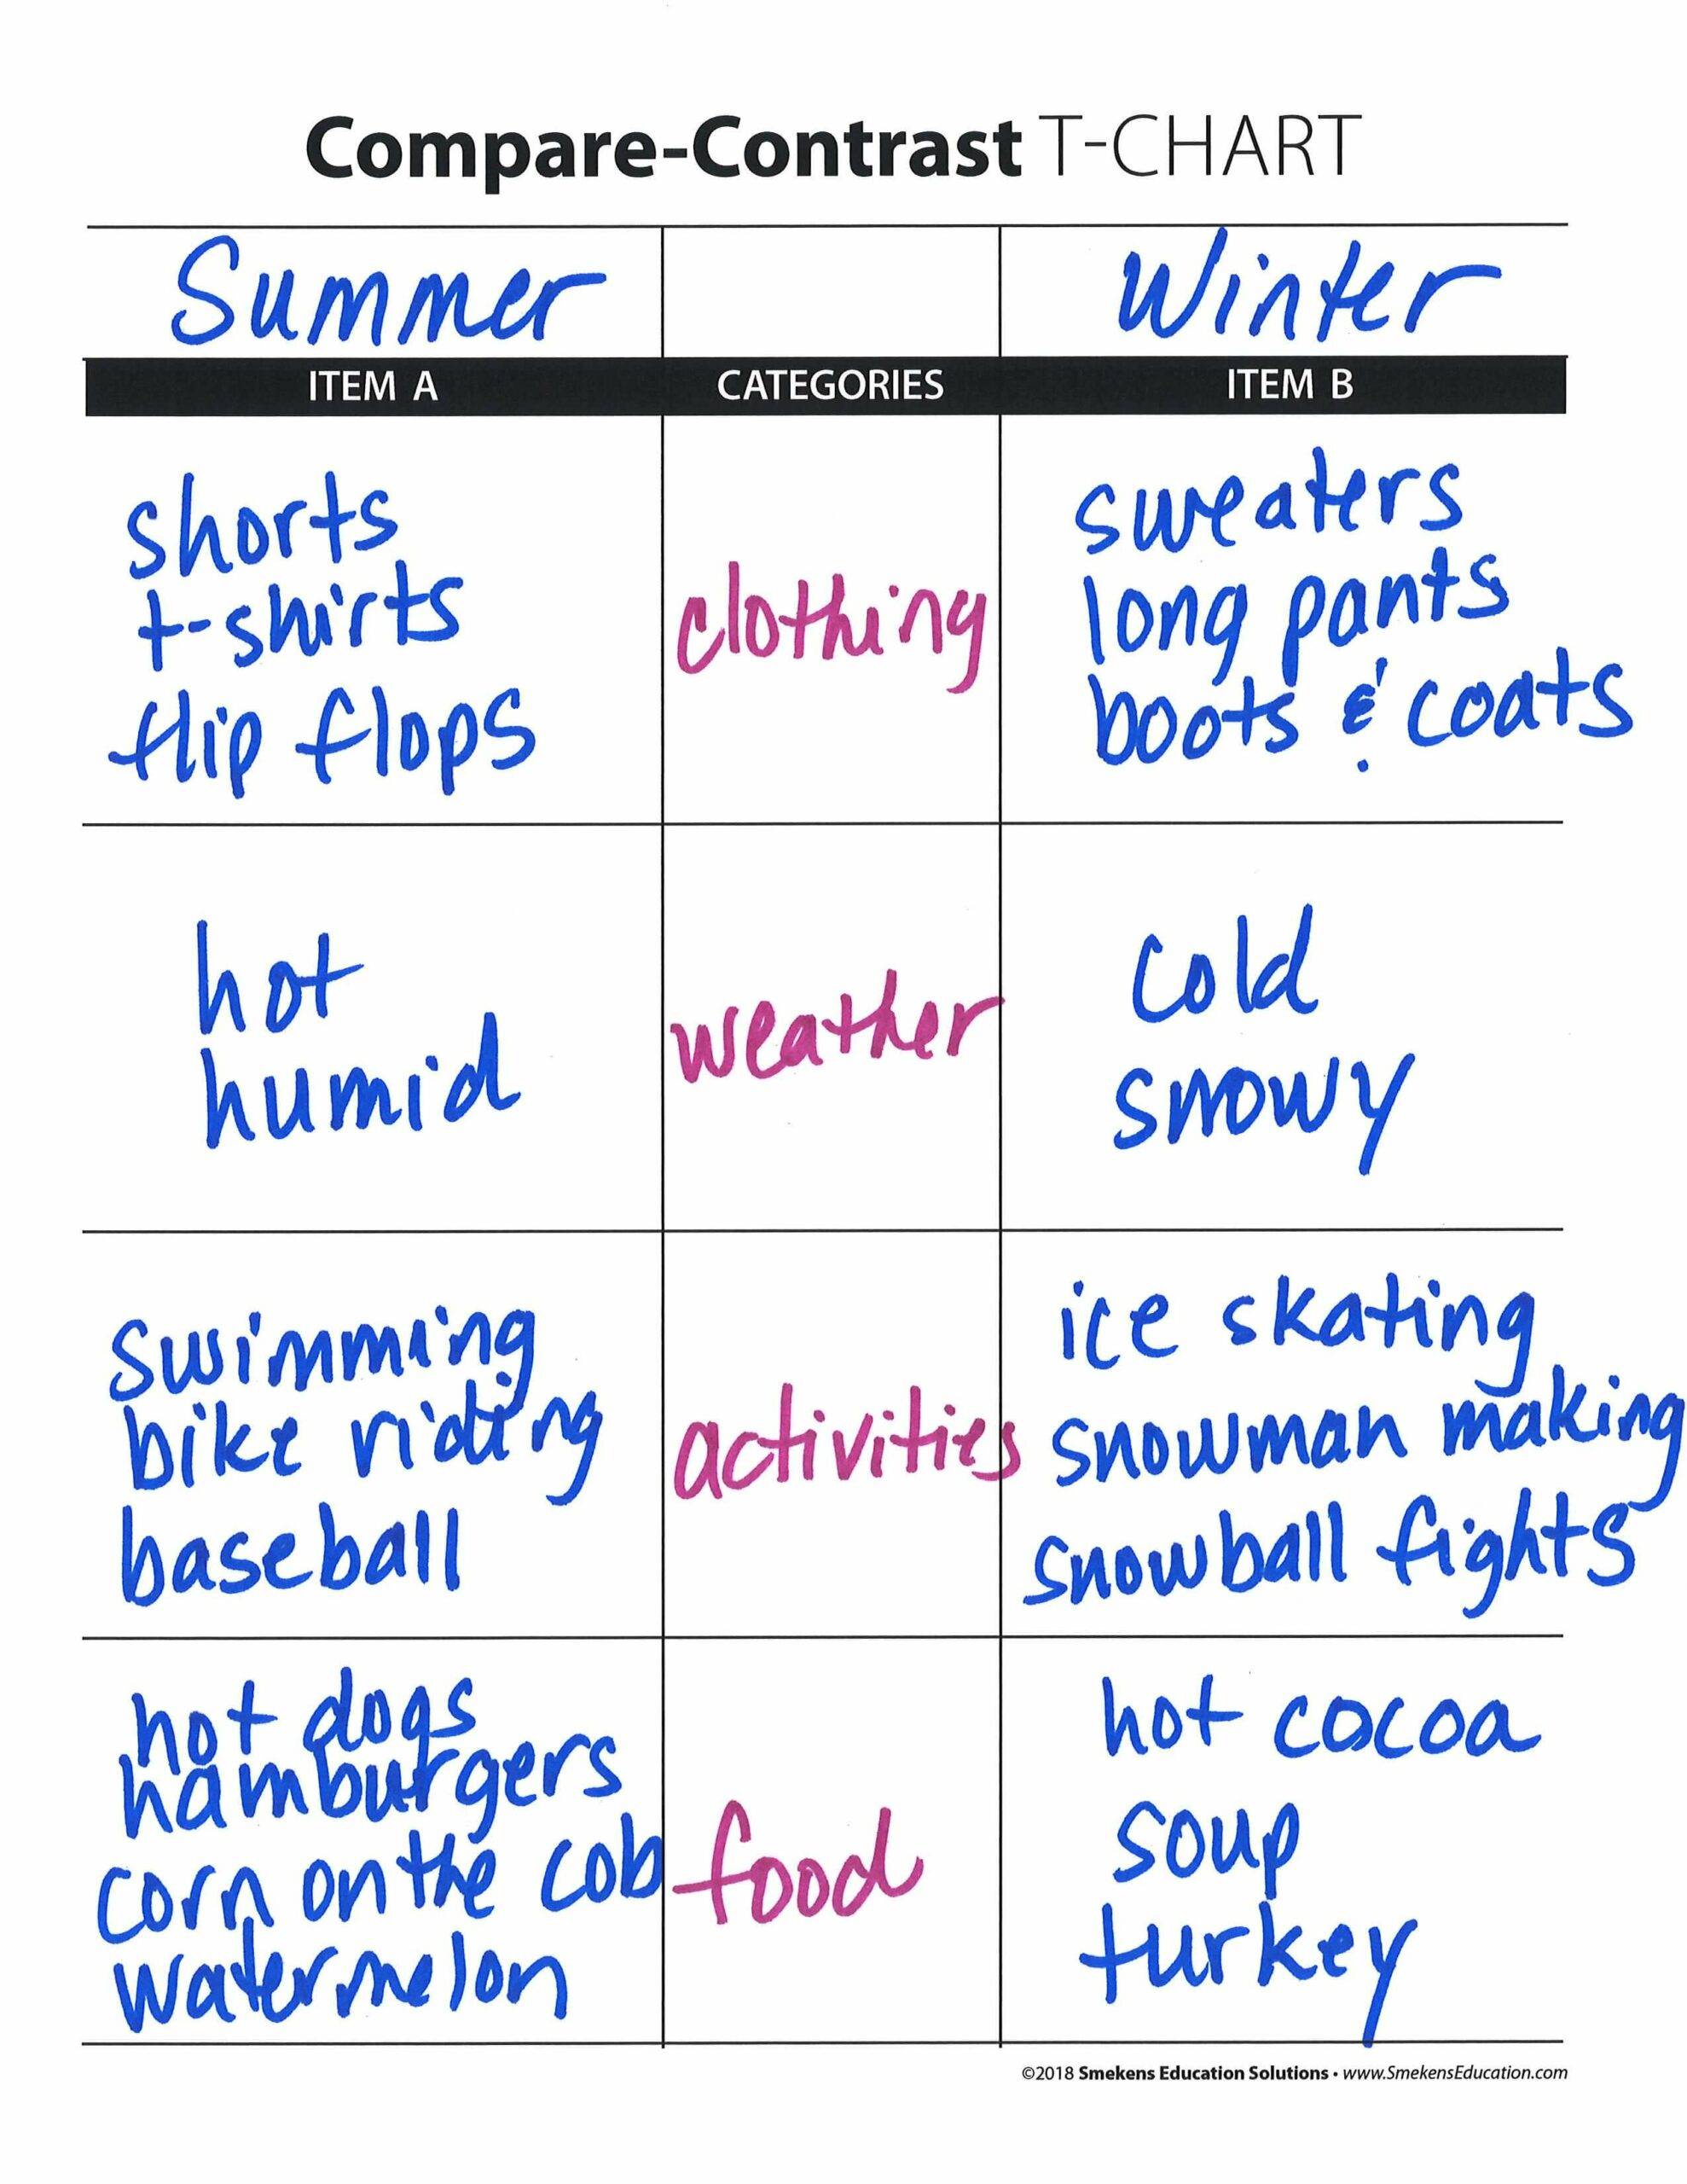
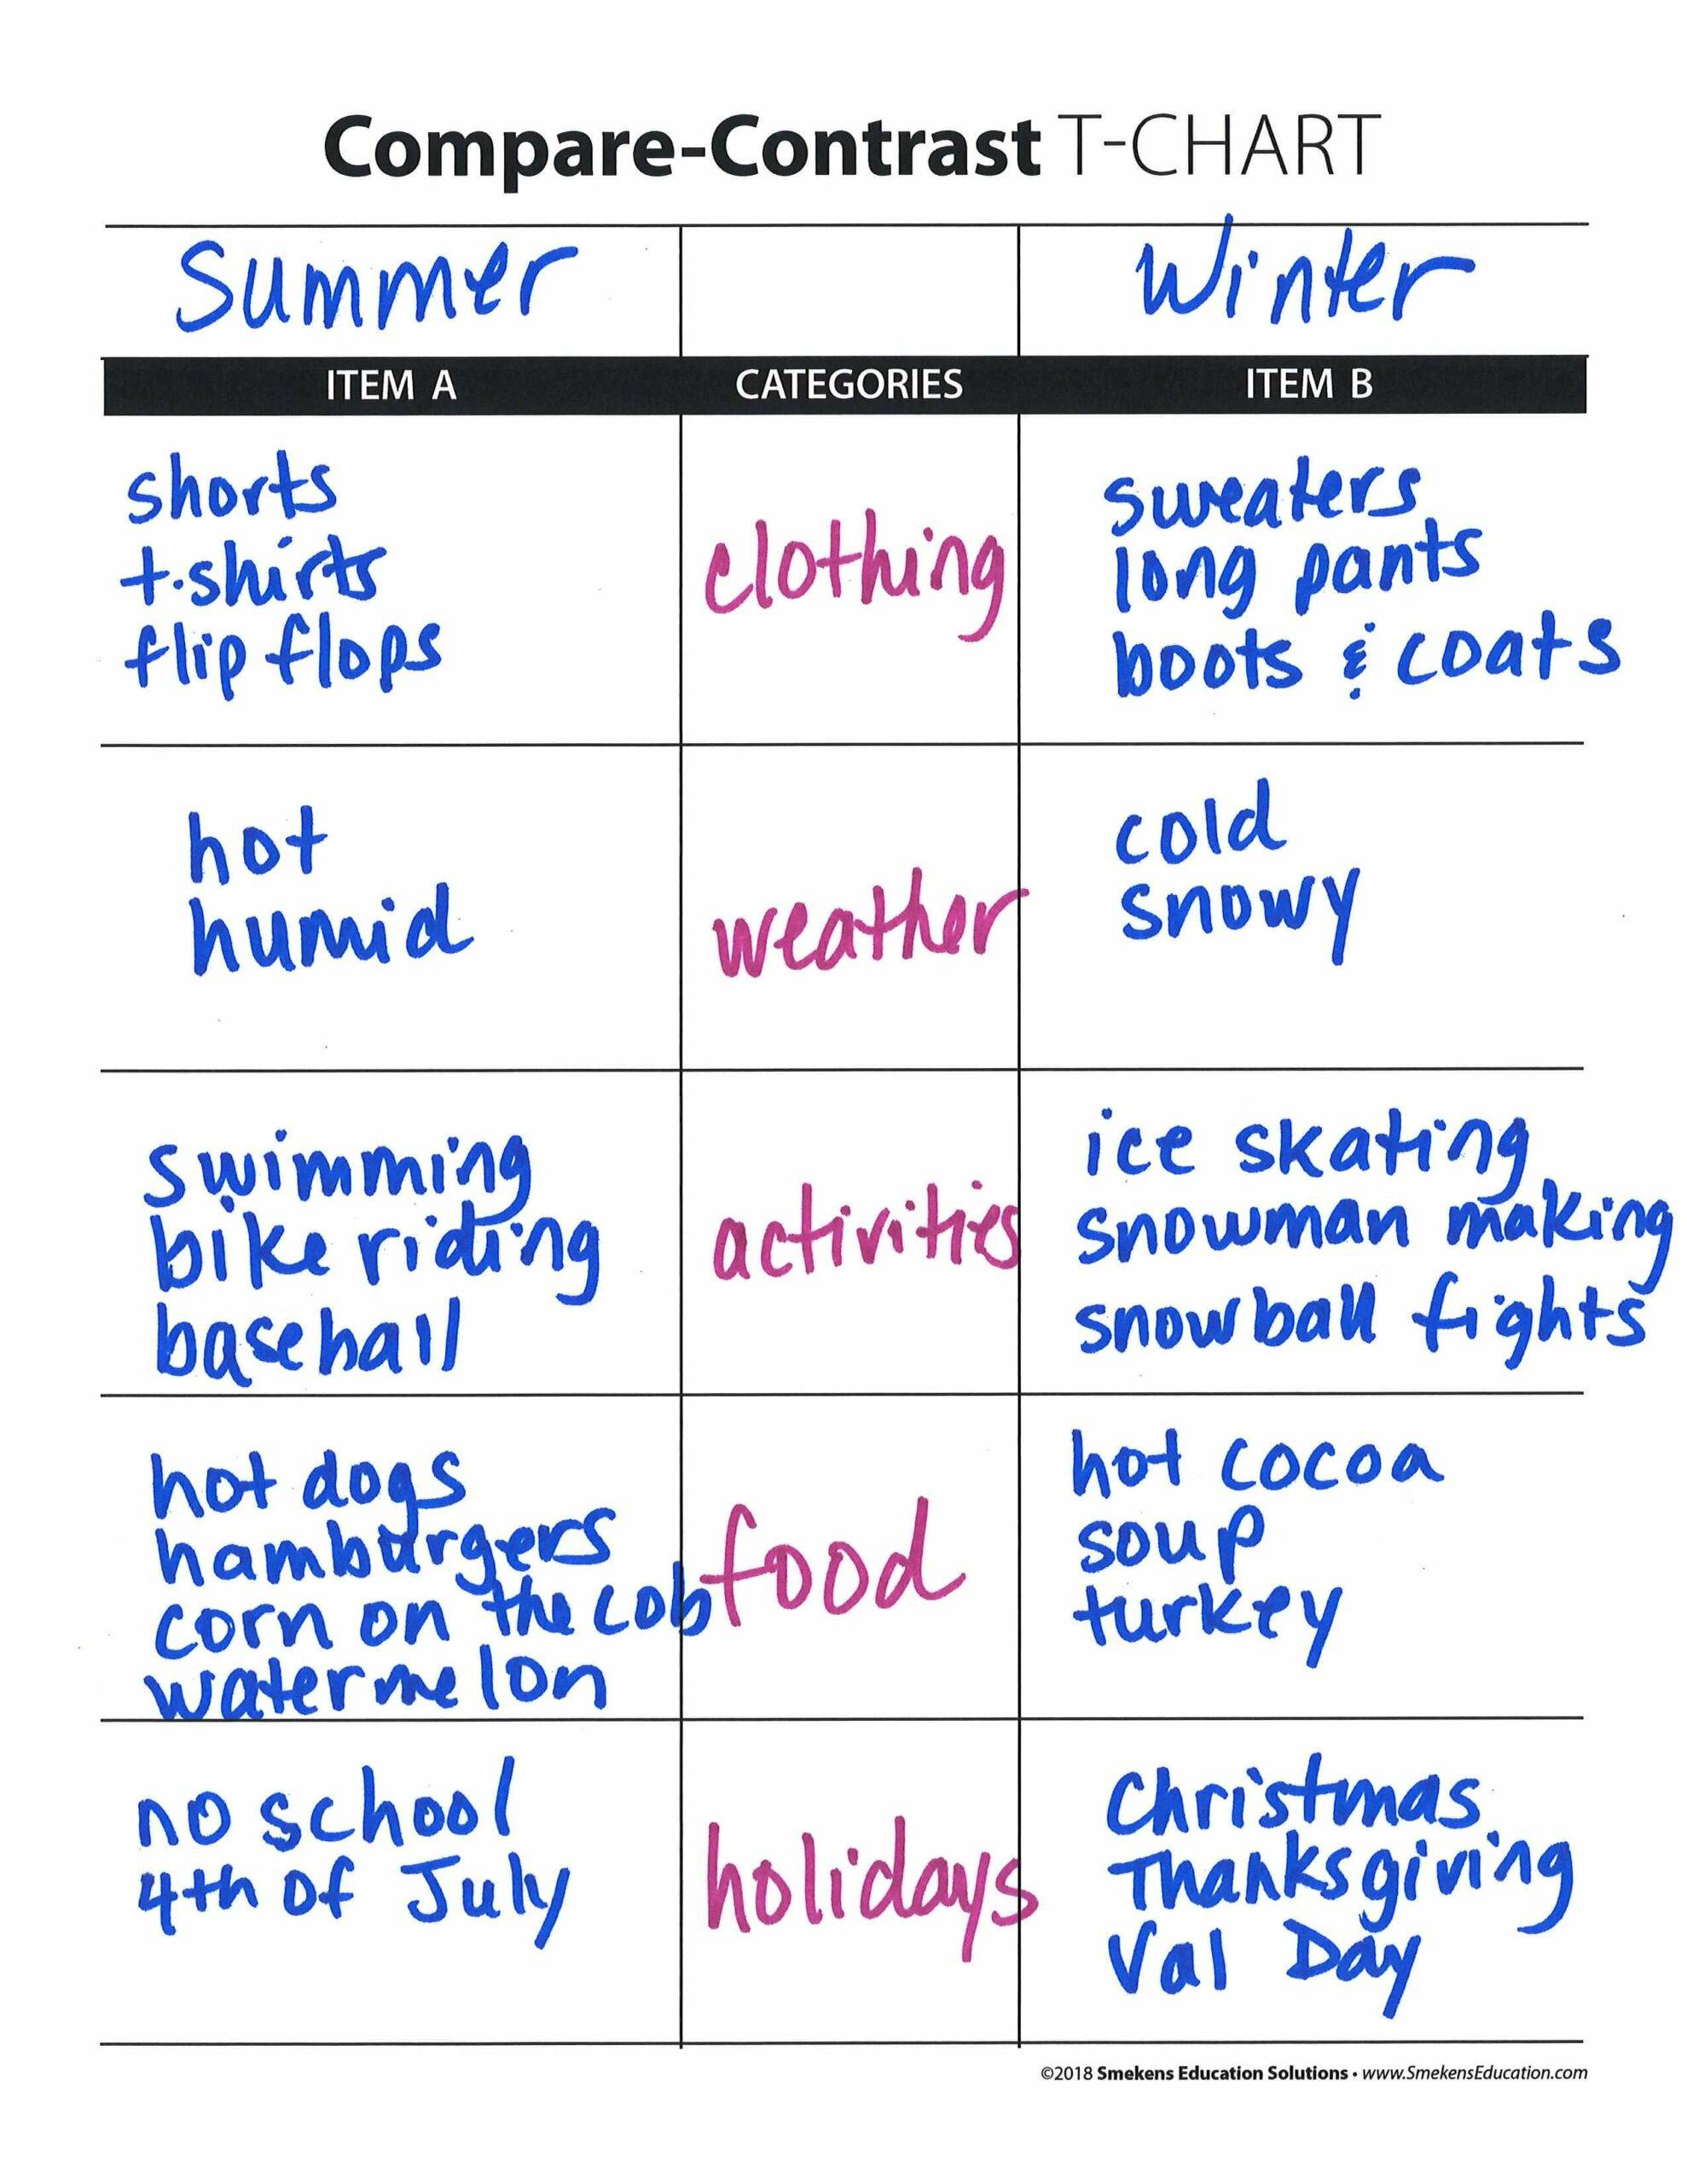
When juggling compare-contrast information on two topics, insert a third column between the Item A and Item B columns. This is where all the categories of comparison will be listed. As students jot information into the appropriate A and B columns, they naturally organize them into parallel rows. This is the whole point of a compare-contrast piece–to analyze the same facets or categories of both items.
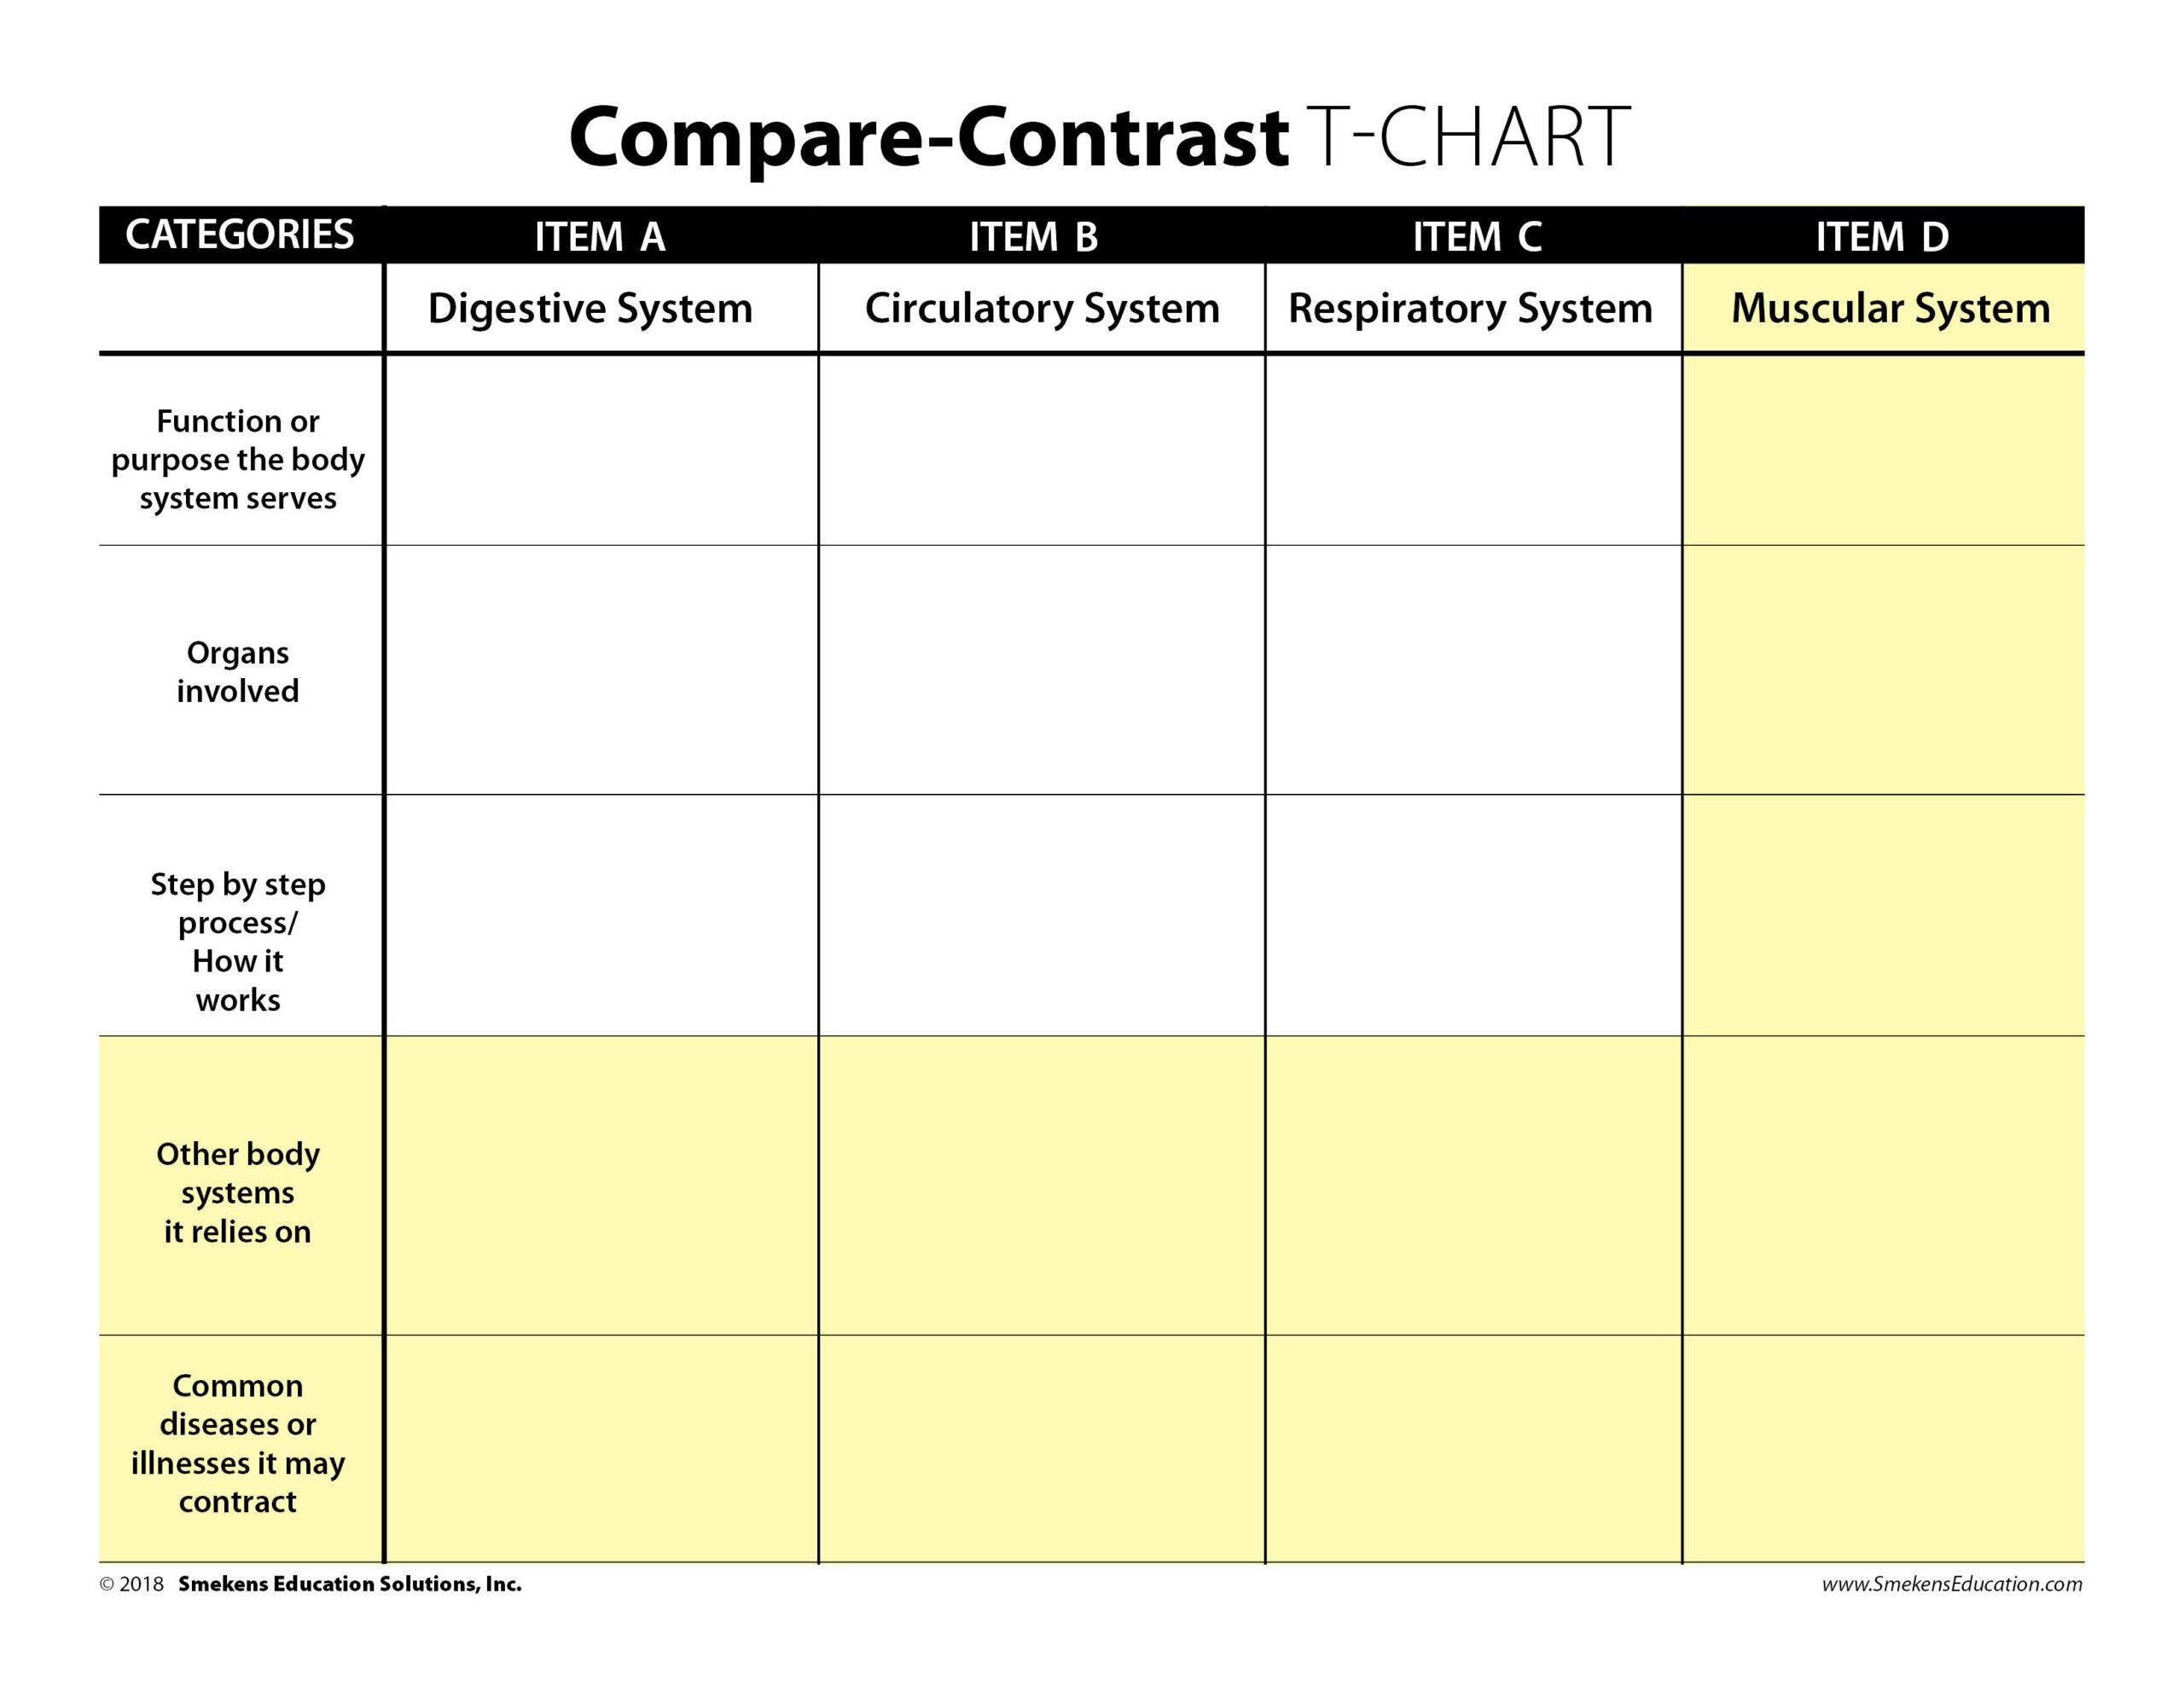
And again, the power in a strong reader/writer resource is that it’s flexible. Therefore, the user can add as many rows or categories as he needs. For each category or row added, the student will generate an additional paragraph of comparative information.
Extend the power of the T-Chart
Compare three or more items.
Prepare to write.
The best reader/writer tools are those flexible for all different purposes, genres, and text structures and adaptable for different content and concepts. The Storyboard, Dissected Web, and T-Chart are three universal graphic organizers that can be used by all teachers in all grades and all subject areas.

